World Map PowerPoint Presentation and Google Slides
World Map PowerPoint Presentation and Google Slides
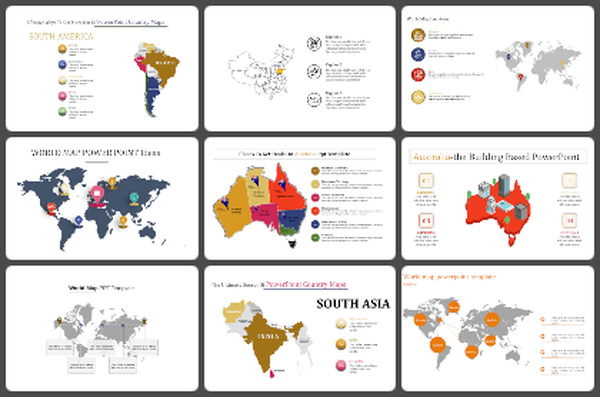
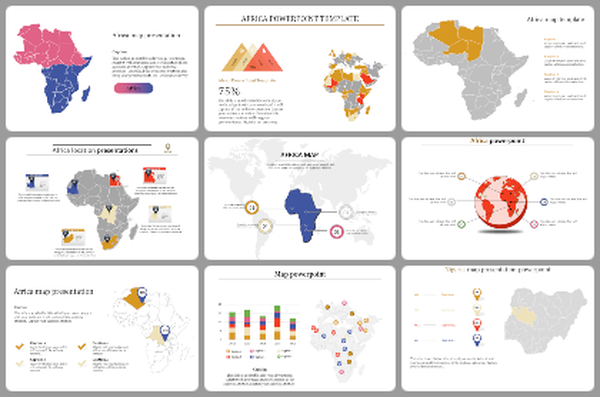
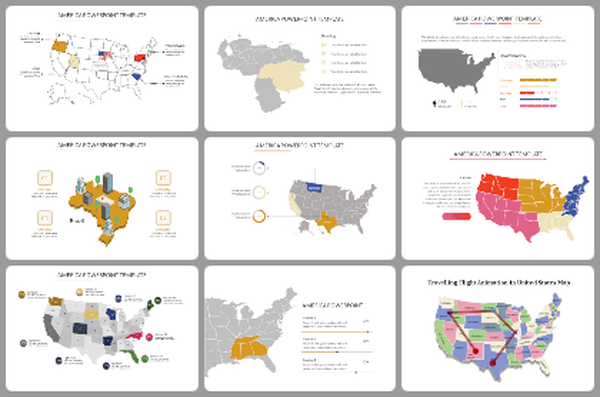
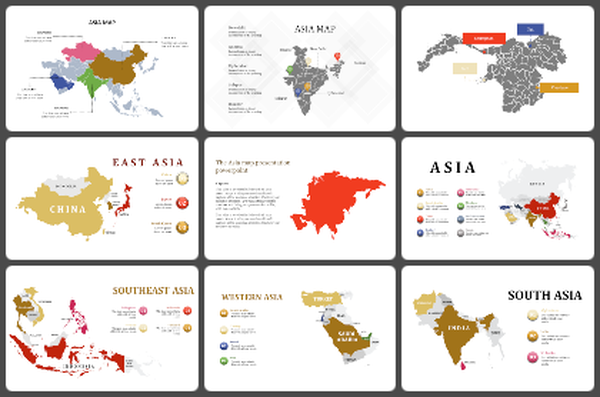
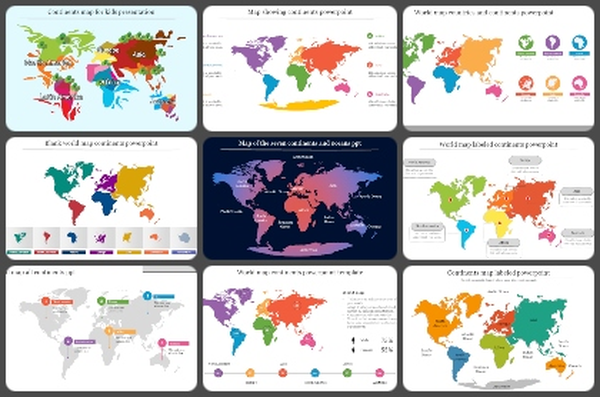
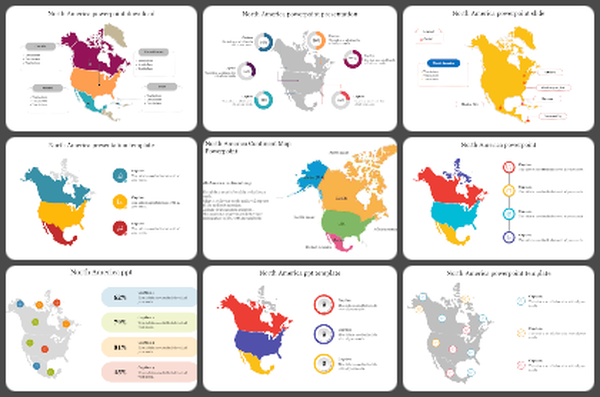
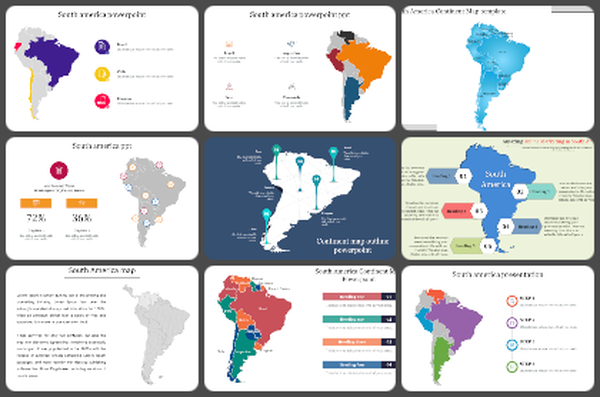
The World Map PowerPoint Presentation and Google Slides template offer a powerful tool for visualizing global data clearly and compellingly. Featuring a world map divided into four quadrants, each quadrant contains a circle representing a percentage along with a caption. The percentages displayed in each quadrant provide a visual representation of data distribution across different regions of the world.
This template is perfect for presenting global data, trends, statistics, or geographical information in business presentations, educational lectures, research reports, or any other context where visualizing global data is essential.
Compatible with both PowerPoint presentations and Google Slides. Available in "16:9" and "4:3" aspect ratios, as well as zip formats. Free template that is 100% customizable to suit your specific data visualization needs. Download this free, customizable template now and bring your global insights to life.
Visualize global data effectively with the World Map PowerPoint Presentation and Google Slides template.


