Pleasant Waterfall Slide PowerPoint Template Designs


Waterfall Slide Template For Presentation
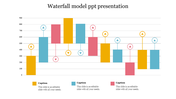
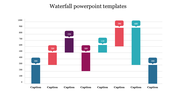
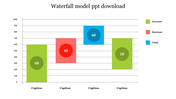
A waterfall chart or bar chart helps in cumulatively visualizing the data. This chart helps understand a series of positive and negative values. The columns are beautifully colored. Use this best slide with six nodes, multicolor codes, and columns to represent the data. You can quickly check out the difference between two different values using this single template. Grab and customize it accordingly.
Features of the template
- 100 % customizable slides and easy to download.
- Slides are available in different nodes & colors.
- The slide contained 16:9 and 4:3 formats.
- Easy to change the slide colors quickly.
- It is a well-crafted template with an instant download facility.
- It is designed with a stunning theme design.
- Best template for PowerPoint presentations.


You May Also Like These PowerPoint Templates
Add to Wishlist
Download
AI Customize

Add to Wishlist
Download
AI Customize

Add to Wishlist
Download
AI Customize

Add to Wishlist
Download
AI Customize

Add to Wishlist
Download
AI Customize

Add to Wishlist
Download
AI Customize

Add to Wishlist
Download
AI Customize

Add to Wishlist
Download
AI Customize

Add to Wishlist
Download
AI Customize

Add to Wishlist
Download
AI Customize

Add to Wishlist
Download
AI Customize

Add to Wishlist
Download
AI Customize


Add to Wishlist
Download
AI Customize

Add to Wishlist
Download
AI Customize

Add to Wishlist
Download
AI Customize


Add to Wishlist
Download
AI Customize

Add to Wishlist
Download
AI Customize

Add to Wishlist
Download
AI Customize
