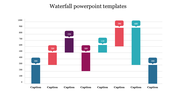
Creative Waterfall Chart Template PowerPoint Slide

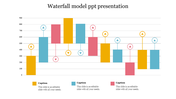
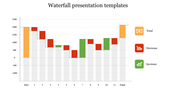


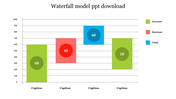

Waterfall Chart Presentation Slide
See your data flow like a waterfall! A Waterfall Chart is a data visualization tool that shows how positive and negative values affect a total, making it easy to analyze changes and identify trends in your data. Our template is a dynamic visual tool that helps you present your data in a clear and engaging way, with easy-to-read graphics and customizable features that make it perfect for business presentations, financial reports, and more. The choice is yours, try it now and see the results!
Features of the template
- 100% customizable slides and easy to download.
- Slides are available in different colors
- The slide has 4:3 and 16:9 formats.
- Easy to change the slide colors quickly.
- Appealing presentation to impress an audience.
- Create feature-rich slide presentations.
- Slides are compatible with Google slides.
- Perfect waterfall chart design.

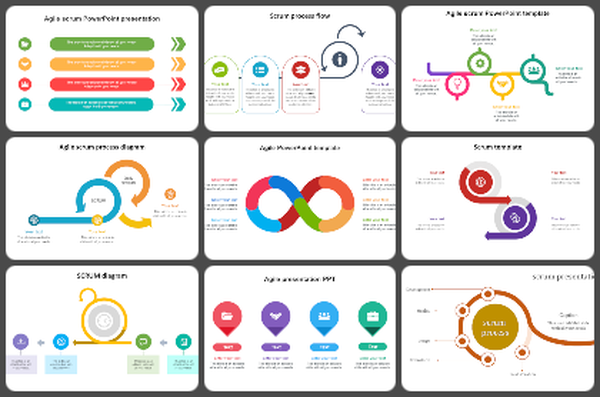
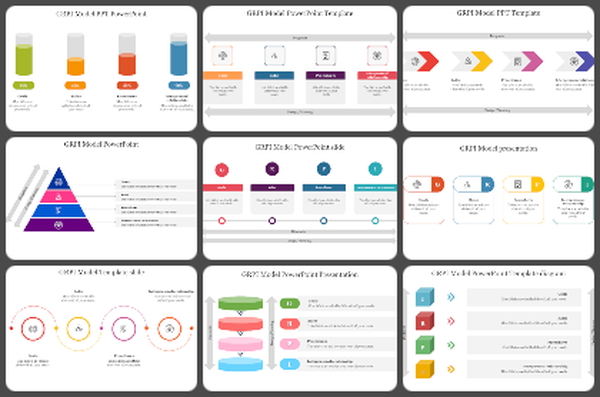
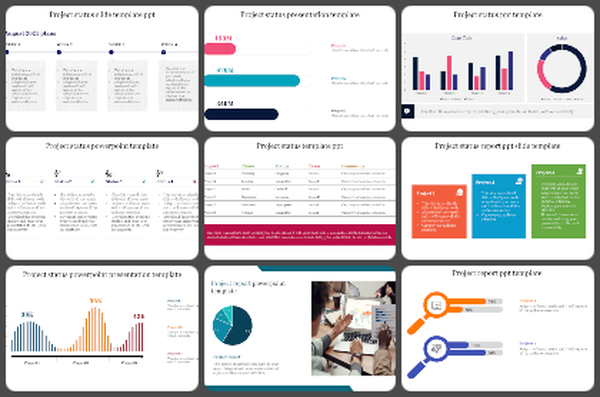
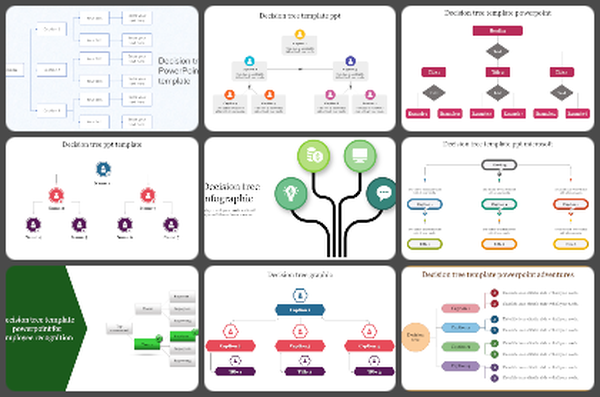
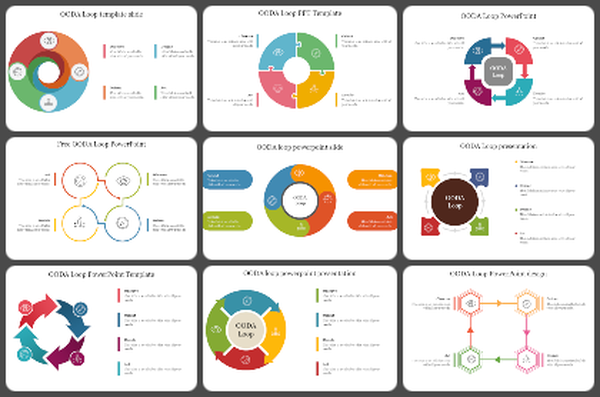
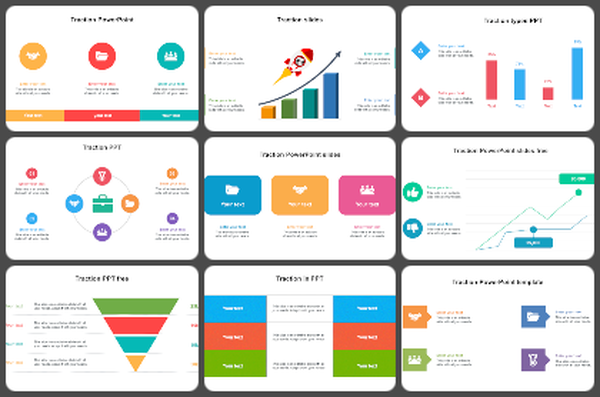
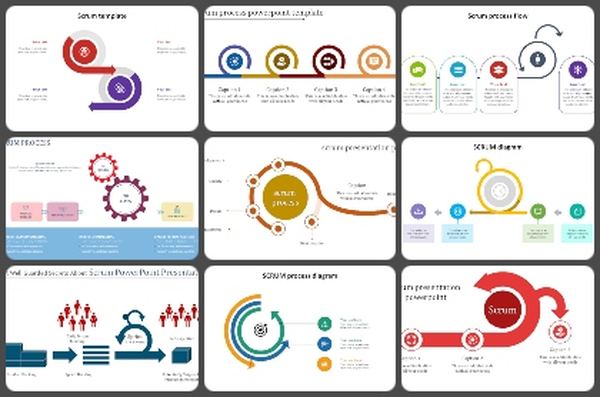
You May Also Like These PowerPoint Templates
Add to Wishlist
Download
AI Customize

Add to Wishlist
Download
AI Customize

Add to Wishlist
Download
AI Customize

Add to Wishlist
Download
AI Customize

Add to Wishlist
Download
AI Customize

Add to Wishlist
Download
AI Customize

Add to Wishlist
Download
AI Customize

Add to Wishlist
Download
AI Customize

Add to Wishlist
Download
AI Customize

Add to Wishlist
Download
AI Customize

Add to Wishlist
Download
AI Customize

Add to Wishlist
Download
AI Customize


Add to Wishlist
Download
AI Customize

Add to Wishlist
Download
AI Customize

Add to Wishlist
Download
AI Customize


Add to Wishlist
Download
AI Customize

Add to Wishlist
Download
AI Customize

Add to Wishlist
Download
AI Customize
