Editable Waterfall Chart PPT And Google Slides Template

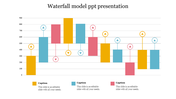


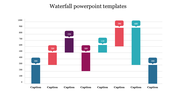
Waterfall Chart PowerPoint Slide
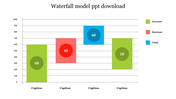
A waterfall chart is a powerful tool that visually represents changes in a data set. It helps to identify the cumulative effect of positive and negative changes over time and is perfect for showing how individual components contribute to a total value. This waterfall chart is highly effective in demonstrating the changes in data and the impact of those changes on the outcome. Our pre-designed waterfall chart PowerPoint template will help to visualize your data with its waterfall structure. Download now!
Features of this template
- 100% customizable slides and easy to download.
- The slide contains 16:9 and 4:3 formats.
- Easy to change the colors of the slide quickly.
- Highly compatible with PowerPoint and Google Slides.


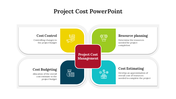
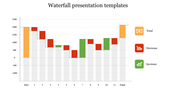
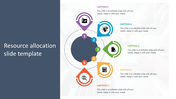
You May Also Like These PowerPoint Templates
Add to Wishlist
Download
AI Customize

Add to Wishlist
Download
AI Customize

Add to Wishlist
Download
AI Customize

Add to Wishlist
Download
AI Customize

Add to Wishlist
Download
AI Customize

Add to Wishlist
Download
AI Customize

Add to Wishlist
Download
AI Customize

Add to Wishlist
Download
AI Customize

Add to Wishlist
Download
AI Customize

Add to Wishlist
Download
AI Customize

Add to Wishlist
Download
AI Customize

Add to Wishlist
Download
AI Customize


Add to Wishlist
Download
AI Customize

Add to Wishlist
Download
AI Customize

Add to Wishlist
Download
AI Customize


Add to Wishlist
Download
AI Customize

Add to Wishlist
Download
AI Customize

Add to Wishlist
Download
AI Customize
