Free - Effective Venn Diagram Slide Deck Template Design
Engaging Venn Diagram Slide With Blue Theme
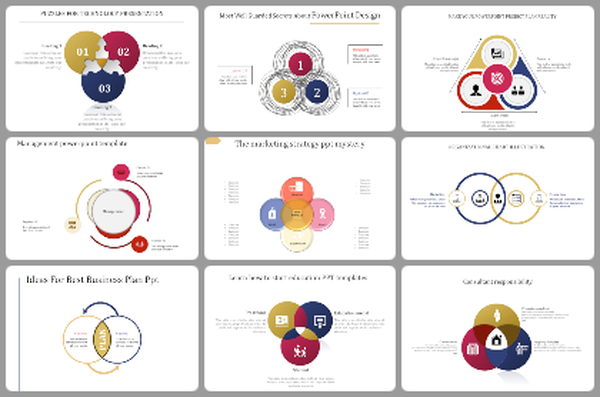
Try our Venn Diagram PowerPoint slide to identify the complex relationships between different data sets. Also, you can compare and contrast two or more ideas, objects, or concepts with this slide. The three overlapping circles help you to display three distinct sets of data. Anyone can easily customize the template to display more than three data sets. Additionally, the template comes with various shapes, icons, and layouts for your specific needs. Download it and edit the elements as per your ideas or process.
Features of the Template
- 100 % customizable slides and easy to download
- Slides are available in different nodes & colors.
- This PowerPoint has a blue theme.
- The slide contained 6:9 and 4:3 formats.
- It comes with three nodes.
- Easy to change the slide colors quickly.
- It is a well-crafted template with an instant download facility.
- It is designed with a stunning design.
You May Also Like These PowerPoint Templates
Free


