Creative Business PPT Template - Graph Model

Business template bar graph with stacked segments for three captions, showing percentages per month from January to December.
P.ID : 8741
    239 views
    22 Downloads
    Get Custom Slides by Experts
    Instantly Access Templates in PowerPoint

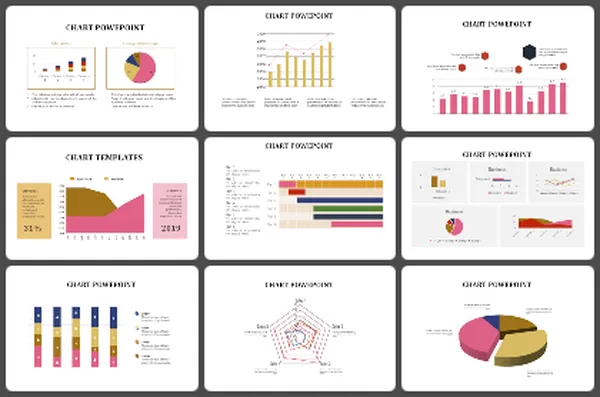
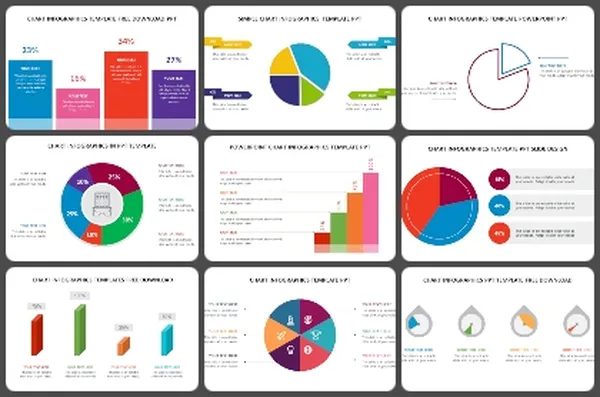
    Business Template: Illuminate Your Insights with Graphical Precision


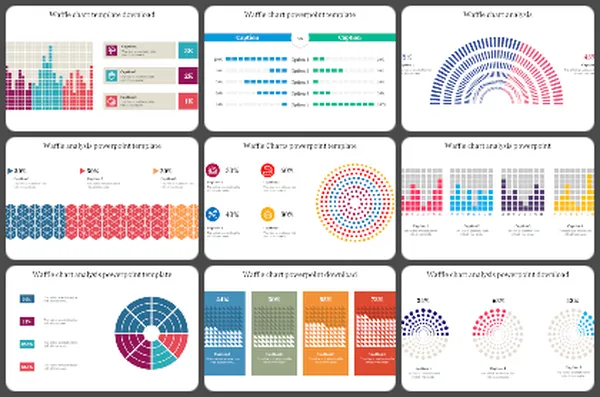
    Step into the world of data-driven decisions with our business PPT template, an indispensable resource for analysts, executives, and professionals navigating the complexities of business trends. This slide transcends the ordinary; it's a visual masterpiece. A graph meticulously displaying month-wise data horizontally and percentage levels vertically comes to life against a More...
    Advertisement

    You May Also Like These PowerPoint Templates

    Add to Wishlist
    Download
    AI Customize
    Horizontal bar chart with four colored bars in red, blue, purple, and pink, each labeled with a numerical value.
    Add to Wishlist
    Download
    AI Customize
    Colorful pie chart PPT template with four segments showing percentages and corresponding descriptions on the right.
    Add to Wishlist
    Download
    AI Customize
    Infographic with a four level bar chart in red, green, orange, and pink, paired with percentage labels and text boxes.
    Add to Wishlist
    Download
    AI Customize
    Chart template with data visualization in teal bars, quote section with large quotation mark, and percentage highlight.
    Add to Wishlist
    Download
    AI Customize
    Colorful bar chart with five vertical bars in ascending order, each labeled with positive values and curved line above.
    Add to Wishlist
    Download
    AI Customize
    Slide showing a gray-shaded area graph with red circular markers and captions for three highlighted years.
    Add to Wishlist
    Download
    AI Customize
    Business PowerPoint slide displaying colorful pie charts with percent values, with text fields on a white backdrop.
    Add to Wishlist
    Download
    AI Customize
    Colorful bar chart PowerPoint slide showing percentage based growth from 25 to 100 percent with placeholder text.
    Add to Wishlist
    Download
    AI Customize
    Slide with five circular pie charts in orange, green, blue, gray, and red, arranged dynamically, displaying a percentage.
    Add to Wishlist
    Download
    AI Customize
    Slide with a stacked area chart in shades of pink, green, and yellow, and three matching circular data labels on the right.
    Add to Wishlist
    Download
    AI Customize
    Infographic PowerPoint slide with four blue bars of increasing height, each associated with a caption and placeholder text.
    Free
    Add to Wishlist
    Download
    AI Customize
    Color coded bar chart layout with sections in red, green, purple, and blue, each with labels and a central icon.
    Add to Wishlist
    Download
    AI Customize
    Mekko chart slides in red and yellow gradients, showcasing various data visualizations with bars and stacked charts.
    Add to Wishlist
    Download
    AI Customize
    KWL slide deck with various layouts, using purple, orange, and red, illustrating the learning process in a structured format.
    Add to Wishlist
    Download
    AI Customize
    Triangular chart with overlapping colored sections labeled 30% to 100%, each linked to captions areas below.
    Add to Wishlist
    Download
    AI Customize
    Circle chart PPT template displaying percentages in four sections with vibrant colors on a white backdrop with captions.
    Add to Wishlist
    Download
    AI Customize
    Business template bar graph with stacked segments for three captions, showing percentages per month from January to December.
    Free
    Add to Wishlist
    Download
    AI Customize
    PPT Chart Infographics Free Download Design Slides
    Add to Wishlist
    Download
    AI Customize
    Buy Now Chart Infographics Template PPT Slide Design