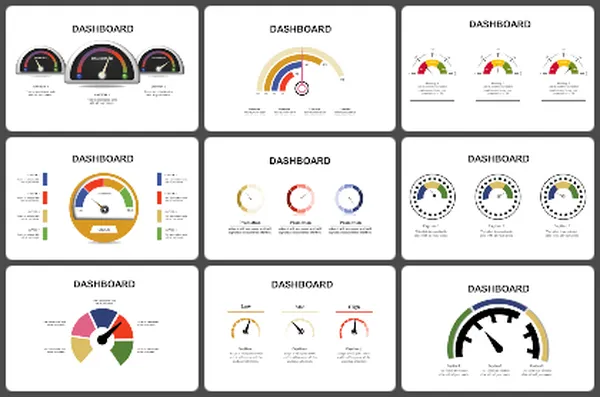
Attractive Tachometer Presentation Template Designs


Best Tachometer Template
Present your detailed summary and tips about speed on the tachometer template. Six nodes are given on the animation's sides with alphabets as icons to form connectivity. The tachometer template is common among automobile agencies to share their ideas through PowerPoint presentations. This is considered one of the best templates in the tachometer category. So, immediately More...
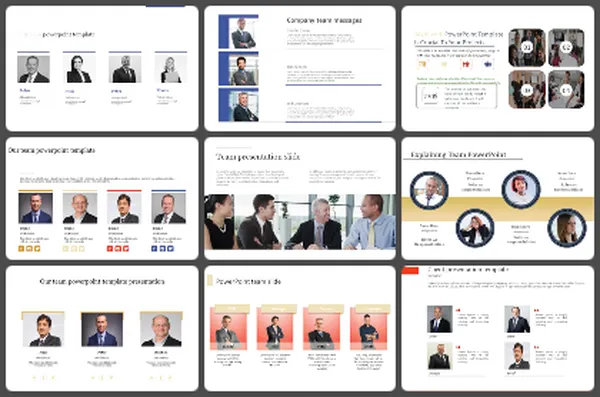
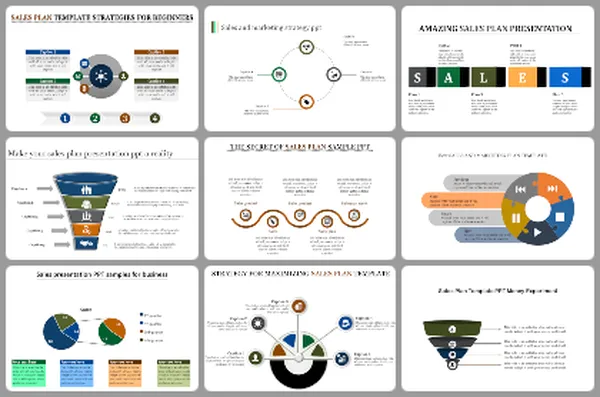

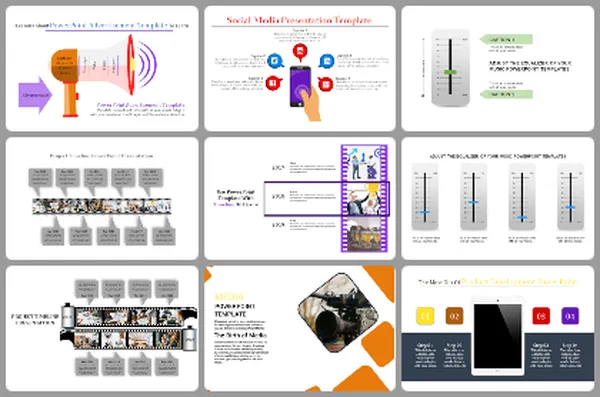

You May Also Like These PowerPoint Templates
Add to Wishlist
Download
AI Customize


Add to Wishlist
Download
AI Customize


Add to Wishlist
Download
AI Customize

Add to Wishlist
Download
AI Customize

Add to Wishlist
Download
AI Customize

Free
Add to Wishlist
Download
AI Customize

Add to Wishlist
Download
AI Customize

Add to Wishlist
Download
AI Customize

Add to Wishlist
Download
AI Customize

Add to Wishlist
Download
AI Customize

Add to Wishlist
Download
AI Customize

Add to Wishlist
Download
AI Customize

Add to Wishlist
Download
AI Customize


Add to Wishlist
Download
AI Customize

Add to Wishlist
Download
AI Customize

Add to Wishlist
Download
AI Customize
