Effective Survey Results Template Presentation Slide

Survey results template featuring percentages and icons, with 80% represented visually in a red block on the right.
P.ID : 63674
    375 views
    44 Downloads
    Get Custom Slides by Experts
    Instantly Access Templates in PowerPoint

    Useful Survey Template


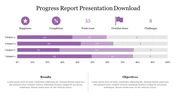
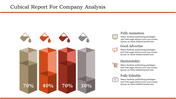
    How about trying this Survey Template for your best professional presentation?. The template is mainly used for Results purposes and effectively contains text areas you can use to explain the topic. The template effectively has a colorful background and three nodes that can make the best outcome.

    About the Template

    The template can give the best outcome with this survey template and make the presentation successful. The template is creative with user-friendly features that can make the changes quickly. This template is 100% satisfactory and amicable to the user.

    Features of the Template

    1. 100% customizable slides
    2. It is easy to download.
    3. Slides available in different nodes & colors.
    4. The slide contained 16:9 and 4:3 formats.
    5. Easy to change the slide colors quickly.
    6. Well-crafted template with instant download facility.
    7. Creative design with text area.

    Advertisement

    You May Also Like These PowerPoint Templates

    Add to Wishlist
    Download
    AI Customize
    Creative QBR Meaning PPT Presentation and Google Slides
    Add to Wishlist
    Download
    AI Customize
    Monthly business review slide showing project names, dates, budgets, and rates in a tabular format with a financial overview.
    Add to Wishlist
    Download
    AI Customize
    Colorful quarterly business review slide showcasing four steps with captions and icons.
    Free
    Add to Wishlist
    Download
    AI Customize
    Project report slide with colorful bar charts showing project progress and team capacity, including RAG status indicators.
    Add to Wishlist
    Download
    AI Customize
    Pack of slides featuring various layouts containing colorful bars indicating metrics on weekly report.
    Free
    Add to Wishlist
    Download
    AI Customize
    Pink gradient table with seven rows and four columns including financial data metrics for a monthly report.
    Add to Wishlist
    Download
    AI Customize
    Colorful quarterly report slide showing bar charts, a pie chart, and task timelines from 2021 to 2024 with three sections.
    Add to Wishlist
    Download
    AI Customize
    Monthly report slide with a grid layout, representing activities with relevant icons and placeholder text.
    Add to Wishlist
    Download
    AI Customize
    Sales report template showcasing key performance metrics with bar and pie charts, set against blue-themed background.
    Add to Wishlist
    Download
    AI Customize
    SEO report slide with a dark background highlighting key metrics in a table format.
    Add to Wishlist
    Download
    AI Customize
    Survey results slide featuring four circular percentage values in different colors with text boxes for placeholder text.
    Add to Wishlist
    Download
    AI Customize
    QBR slide with four icons with descriptions accompanied by a progress bar chart displaying the status for each task.
    Add to Wishlist
    Download
    AI Customize
    Weekly schedule with seven colorful circles for each day, followed by a to do and teal notes section at the bottom.
    Add to Wishlist
    Download
    AI Customize
    Social media reports slide, including color coded bar charts for followers, age demographics, and engagement statistics.
    Add to Wishlist
    Download
    AI Customize
    Dark slide with a graphic of hands holding a tablet, bar charts on the left, and text on the right.
    Add to Wishlist
    Download
    AI Customize
    Editable Teaser PowerPoint And Google Slides Template
    Add to Wishlist
    Download
    AI Customize
    Slide featuring a colorful incident report with recorded details, and a description of the event with progress percentages.
    Add to Wishlist
    Download
    AI Customize
    Sales report slide featuring a sales summary table, bar graph comparing won and lost sales, and charts for revenue share.
    Add to Wishlist
    Download
    AI Customize
    Weekly report slide showing a grid with five weeks and seven days plus sections for goals and notes at the bottom.