Survey Infographic PowerPoint And Google Slide Template

Combination of a horizontal bar chart and a vertical red bars on the right, with three percentage circles at the bottom.
P.ID : 63598
    454 views
    47 Downloads
    Get Custom Slides by Experts
    Instantly Access Templates in PowerPoint

    Survey Infographic PowerPoint Template


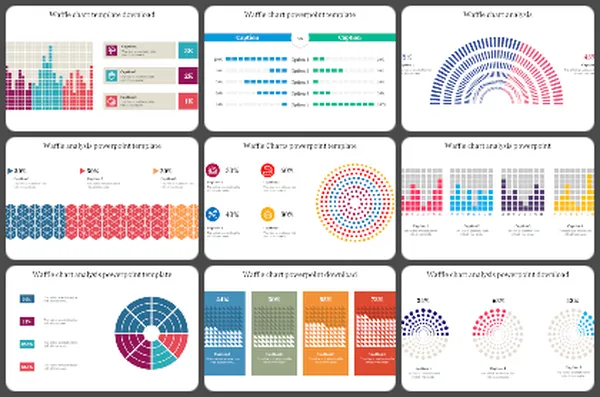
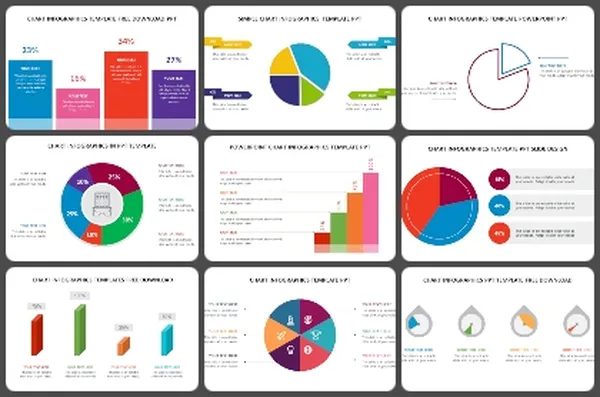
    A survey is a data collection method that gathers information or opinions through structured questions, providing valuable insights for research, analysis, and decision-making across diverse fields. Introducing our Survey Infographic PowerPoint template, meticulously designed for a seamless blend of creativity and professionalism. The concept takes center stage, offering a multicolor theme that symbolizes the diversity More...

    Advertisement

    You May Also Like These PowerPoint Templates

    Add to Wishlist
    Download
    AI Customize
    Practical Metric Chart PowerPoint Presentation Template
    Add to Wishlist
    Download
    AI Customize
    Chart infographic with a world map marked with colored pins, a donut chart, and a bar graph with a caption area.
    Add to Wishlist
    Download
    AI Customize
    Multicolored mekko chart displaying data for five topics, with percentages and totals in a blue column on the right.
    Add to Wishlist
    Download
    AI Customize
    Quad chart template with four colorful sections labeled from one to four, each with an icon, and corresponding text area.
    Free
    Add to Wishlist
    Download
    AI Customize
    Waterfall slide showing multiple bars in varying colors with value labels and captions along the axis.
    Add to Wishlist
    Download
    AI Customize
    Seven-segment radial chart in various colors, labeled 1 to 7, with editable text descriptions surrounding the chart.
    Add to Wishlist
    Download
    AI Customize
    Cockpit charts slide showing a donut chart with three data points and a global map with gender distribution.
    Add to Wishlist
    Download
    AI Customize
    Slide illustrating a goal chart with an arrow pointing at a target and four colored bars showing percentage milestones.
    Add to Wishlist
    Download
    AI Customize
    Combination of a horizontal bar chart and a vertical red bars on the right, with three percentage circles at the bottom.
    Add to Wishlist
    Download
    AI Customize
    Slide with three bar charts, a pie chart, and arrow graphics in vibrant colors for data visualization.
    Add to Wishlist
    Download
    AI Customize
    Color coded team schedule with horizontal bars representing tasks across days of the week, labeled by name.
    Add to Wishlist
    Download
    AI Customize
    Radial chart with four concentric arcs labeled 30%, 40%, 70%, and 100%, connected to icons and caption areas.
    Free
    Add to Wishlist
    Download
    AI Customize
    Four colorful 3D bars in varying heights and percentages, alongside icons and descriptions on a beige background.
    Free
    Add to Wishlist
    Download
    AI Customize
    Colorful 3D bar chart infographic with varying percentages with placeholder text.
    Free
    Add to Wishlist
    Download
    AI Customize
    Preventive maintenance PowerPoint slide with purple mountain peaks from maintenance to system, with icons below each.
    Add to Wishlist
    Download
    AI Customize
    Slide displaying a percentage model with four color coded sections representing various percentages with placeholder text.
    Free
    Add to Wishlist
    Download
    AI Customize
    Orange and black cylindrical bars in a 3D chart design placed on a gray base with descriptive captions.
    Add to Wishlist
    Download
    AI Customize
    Colorful 3D bar chart with pink, red, blue, and yellow bars, each labeled with percentages.