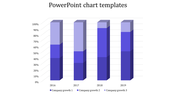
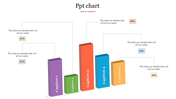
Statistics PPT Free Download Slide - Multicolor Bar Chart

Bar graph on a slide showing data from 2016 to 2019, with a title about statistics and a caption area section.
P.ID : 8329
    1.4K+ views
    117 Downloads
    Get Custom Slides by Experts
    Instantly Access Templates in PowerPoint

    Statistics Presentation Slide

    Statistics is the study of collecting, analyzing, and interpreting data. A guide to statistics involves learning about different types of data, probability, hypothesis testing, correlation, regression, and other statistical methods. It is important to understand the concepts of statistical inference, significance levels, and confidence intervals to draw accurate conclusions from data. A solid understanding of statistics More...
    Advertisement

    You May Also Like These PowerPoint Templates

    Add to Wishlist
    Download
    AI Customize
    Marketing KPI template with three circular icons, and bar and line charts in blue, gray, and green below.
    Free
    Add to Wishlist
    Download
    AI Customize
    Three column layout with blue megaphone, orange lightbulb, and red envelope icons on a beige background.
    Add to Wishlist
    Download
    AI Customize
    3D cone chart with orange, pink, and blue segments, placed on a gray platform with a white background.
    Add to Wishlist
    Download
    AI Customize
    Colorful timeline PowerPoint chart illustrating shifts for various employees throughout the day with peak hours highlighted.
    Free
    Add to Wishlist
    Download
    AI Customize
    Creative infographic with a curved orange graph divided into four steps, each with an icon and label.
    Free
    Add to Wishlist
    Download
    AI Customize
    A simple chart slide with overlaid blue, green, orange, and yellow circles of varying sizes with a graph and captions.
    Add to Wishlist
    Download
    AI Customize
    Bar chart slide showing the performance of four products with categories like sales growth, market share, and profit margin.
    Add to Wishlist
    Download
    AI Customize
    Dashboard layout showing net worth value, asset categories in a pie chart, and bar chart for real estate comparisons.
    Free
    Add to Wishlist
    Download
    AI Customize
    Business plan infographic with a four-quadrant layout labeled with sales strategies and a 3D pie chart on the right.
    Add to Wishlist
    Download
    AI Customize
    Bar chart with green hues, showing data for six categories, with side status boxes and light text.
    Add to Wishlist
    Download
    AI Customize
    Gantt chart PowerPoint template showing a timeline for multiple targets across January, February, and March, with milestones.
    Add to Wishlist
    Download
    AI Customize
    PowerPoint slide showcasing a chart with project status trends and a progress bar for each year.
    Add to Wishlist
    Download
    AI Customize
    Four panel chart slide featuring a line, bar, and pie chart, each displaying data trends and comparisons.
    Add to Wishlist
    Download
    AI Customize
    Creative PowerPoint slide with two lines on a chart yellow and red with a green dot marking the highest point on the line.
    Add to Wishlist
    Download
    AI Customize
    Bar chart slide with colorful conical graphs representing different categories, accompanied by labeled captions and icons.
    Add to Wishlist
    Download
    AI Customize
    Slide featuring a businessman pointing at a board with a pie chart and two circular progress visuals in red and yellow.
    Add to Wishlist
    Download
    AI Customize
    Slide featuring three green pie charts and a line graph below, illustrating data trends for different categories.
    Free
    Add to Wishlist
    Download
    AI Customize
    Bar graph showing revenue and sales data for 3D Ocean, Web, Graphics, Video, and Design in a business plan presentation.