Affordable Statistics PowerPoint And Google Slides Template

Statistics slide with bar charts, line graphs, and pie charts showing data trends and analysis across different times.
P.ID : 32951
    1000 views
    130 Downloads
    Get Custom Slides by Experts
    Instantly Access Templates in PowerPoint

    Incredible Statistics PowerPoint Template


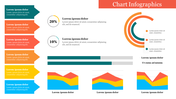
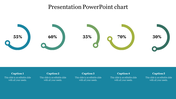
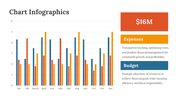
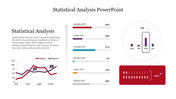
    Statistics is the science of collecting, analyzing, interpreting, and presenting data to reveal patterns, trends, and relationships in datasets. It uses descriptive statistics to summarize data and inferential statistics to draw conclusions from sample data. Important in research, decision-making, and problem-solving in fields as diverse as business, economics, health, and social sciences, statistics provide quantitative insights for informed decisions, policymaking, and performance evaluation. Whether studying market trends, evaluating interventions, or analyzing survey responses, statistics reveal insights for innovation and process improvement. This template helps professionals, researchers, academics, analysts and students facilitate impactful presentations on statistical analysis, research findings and data-driven insights. Provides customizable templates with charts, graphs, tables, and graphs that effectively visualize data and communicate key findings. With fully editable slides, users can tailor content to specific needs and objectives, ensuring clarity and engagement. A valuable resource for academic lectures, business presentations, and research conferences, this template empowers presenters to compellingly communicate statistical concepts, insights, and results. Optimizing this template enhances presentations, engages audiences, and inspires action based on data-driven evidence.


    Features of this template


    • 100% customizable slides and easy to download.
    • The slide contains 16:9 and 4:3 formats.
    • Easy to change the colors of the slide quickly.
    • Highly compatible with PowerPoint and Google Slides.
    Advertisement

    You May Also Like These PowerPoint Templates

    Add to Wishlist
    Download
    AI Customize
    Get our Predesigned Chart Presentation Template Slides
    Free
    Add to Wishlist
    Download
    AI Customize
    Editable Chart Template PPT Slide Design 2-Node
    Add to Wishlist
    Download
    AI Customize
    Buy Highest Quality Predesigned Chart Template PPT
    Add to Wishlist
    Download
    AI Customize
    Statistics Project PowerPoint Template and Google Slides
    Add to Wishlist
    Download
    AI Customize
    Illustration of people analyzing charts on large screens, with text on the right side.
    Add to Wishlist
    Download
    AI Customize
    Awesome Statistics PowerPoint And Google Slides Template
    Add to Wishlist
    Download
    AI Customize
    Statistics slide with bar charts, line graphs, and progress indicators showing mobile users and social media budgets.
    Add to Wishlist
    Download
    AI Customize
    Diffusion Model PowerPoint Presentation and Google Slides
    Add to Wishlist
    Download
    AI Customize
    Statistics slide showing four bar charts with monthly data for April to July, including numerical values and icons.
    Add to Wishlist
    Download
    AI Customize
    Astounding Inferential Statistics PPT And Google Slides
    Free
    Add to Wishlist
    Download
    AI Customize
    Colorful statistics slide featuring various charts and graphs, including bar graphs, pie charts, and gender icons.
    Add to Wishlist
    Download
    AI Customize
    Buy This Statistics Clipart PowerPoint And Google Slides
    Free
    Add to Wishlist
    Download
    AI Customize
    Data statistics template featuring bar graphs, percentages, and text sections for detailed analysis with caption areas.
    Add to Wishlist
    Download
    AI Customize
    Best Business Statistics Presentation Template Design
    Add to Wishlist
    Download
    AI Customize
    Easy To Editable Statistics PowerPoint And Google Slides