Best Spider Graph PowerPoint Presentation Template

Spider graph displaying data from 2018 to 2023 with two data sets highlighted in orange and pink lines.
P.ID : 64171
    312 views
    42 Downloads
    Get Custom Slides by Experts
    Instantly Access Templates in PowerPoint

    Two Noded Spider Graph PPT Slide

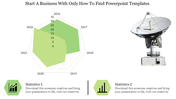
    Get started with this Spider Graph PowerPoint Template. This slide is used to visually compare a variety of entities. You can use this template in business or education presentations. It can also be used to represent team schedules, products, or metrics. The flexibility of this chart slide allows for endless customization and creativity. Download Now to make excellent presentations. 


    The Spider Graph PowerPoint Template has a multicolor graph representing multiple data points. It is also known as a web chart or star chart. The five corners of graph are labeled with the years 2018 to 2022. It also includes two text holders to present your notes. Using this slide, you can easily make an informative presentation. Grab Now!


    Features of this template:

    1. 100% customizable slides and easy to download.

    2. Slides available in different nodes & colors.

    3. The slide contained 16:9 and 4:3 format.

    4. Easy to change the slide colors quickly.

    5. Well-crafted template with instant download facility.

    6. It has a colorful web chart. 

    Advertisement

    You May Also Like These PowerPoint Templates

    Add to Wishlist
    Download
    AI Customize
    Slide showing a graph of the Dunning-Kruger Effect with stages from knowing nothing to becoming an expert with a title text.
    Add to Wishlist
    Download
    AI Customize
    Narrative arc slide displaying key plot stages with placeholder text areas.
    Add to Wishlist
    Download
    AI Customize
    Line graph slide with two data series in red and yellow, showing item based data fluctuations and a text caption.
    Add to Wishlist
    Download
    AI Customize
    Graph showing an upward curve with captions along key points, indicating growth or improvement over time.
    Add to Wishlist
    Download
    AI Customize
    Curve Graph PPT Template & Google Slides for Presentation
    Add to Wishlist
    Download
    AI Customize
    A collection of story arc slides featuring graphs illustrating rising action, climax, and resolution points for storytelling.
    Add to Wishlist
    Download
    AI Customize
    An S shaped curve graph with three key points, illustrating growth or change over time with captions.
    Add to Wishlist
    Download
    AI Customize
    Best Positively Skewed Histogram Presentation Slide
    Add to Wishlist
    Download
    AI Customize
    A bell curve chart slide with an orange shaded area representing percentages for standard deviations.
    Add to Wishlist
    Download
    AI Customize
    A four quadrant graph with colorful sections labeled from 01 to 04 in the center. Each quadrant has placeholder text area.
    Add to Wishlist
    Download
    AI Customize
    Graph representation of the Dunning Kruger effect, mapping confidence levels from know nothing to expert across four stages.
    Add to Wishlist
    Download
    AI Customize
    Editable Kano Model PowerPoint and Google Slides Themes
    Add to Wishlist
    Download
    AI Customize
    Bradley curve chart with four sections in shades of maroon, and orange, illustrating progression through stages.
    Add to Wishlist
    Download
    AI Customize
    Crossing the Chasm PowerPoint Template and Google Slides
    Add to Wishlist
    Download
    AI Customize
    Graph illustrating the law of diminishing marginal return with a curved line between input and output, with labeled sections.
    Add to Wishlist
    Download
    AI Customize
    Graphical representation of a story arc showing stages from exposition to resolution, with labeled points for each action.
    Add to Wishlist
    Download
    AI Customize
    Best Plot Diagram PowerPoint and Google Slides Themes
    Add to Wishlist
    Download
    AI Customize
    Line graph template with two lines showing data across seven items, with percentage icons and captions below.