SmartArt Pie Chart PowerPoint Template & Google Slides
SmartArt Pie Chart Presentation Slide
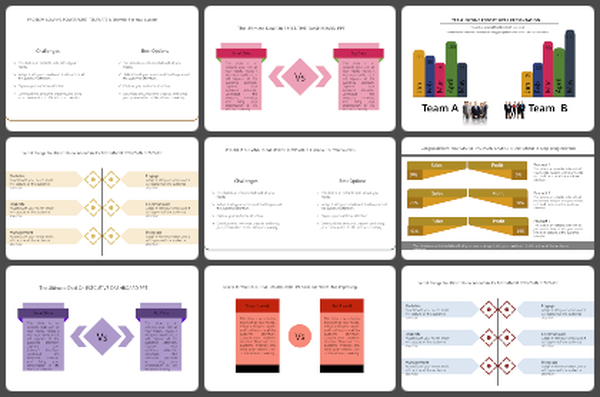
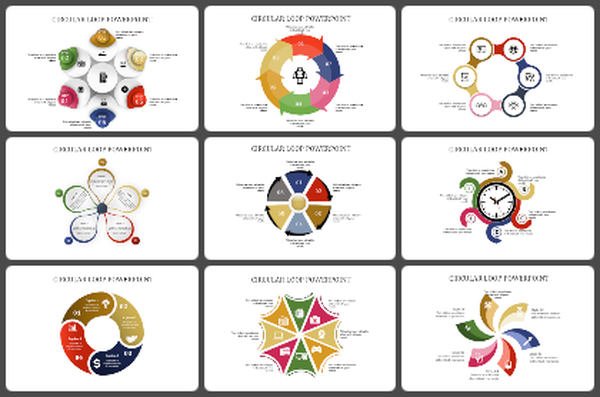
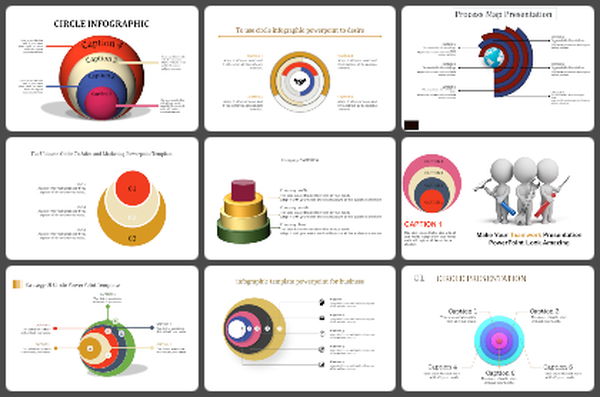
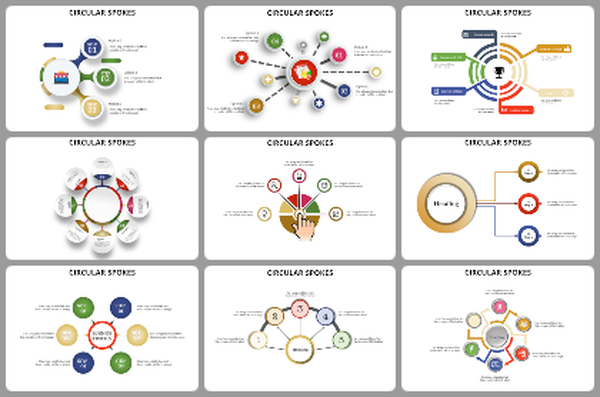
The SmartArt pie chart is a visual representation tool that presents data in a circular form divided into segments, like slices of a pie. Each segment represents a proportion of the whole data set, making it easy to compare and understand different parts of the data. The SmartArt pie chart is an excellent tool for presenting complex data in a clear and concise way, making it ideal for business reports, presentations, and educational materials. With its customizable design and easy-to-use features, the SmartArt pie chart is a valuable addition to any data analysis or presentation toolkit. Ensure that you utilize this beneficial resource to improve the quality of your visual communication and to increase the engagement and comprehensibility of your data.
Features of the template
- 100% customizable slides and easy to download.
- Slides are available in different nodes & colors.
- The slide contains 16:9 and 4:3 formats.
- Easy to change the colors of the slide quickly.
- Well-crafted template with an instant download facility.
- Highly compatible with PowerPoint and Google Slides.
- Our template is designed to help you simplify complex concepts.
- Our user-friendly template is perfect for both beginners and advanced users.


