Mind Blowing Smart Chart PowerPoint And Google Slides

Smart chart template slide showing bar and line charts labeled net profit alongside numbered caption area.
P.ID : 9313
    2.8K+ views
    192 Downloads
    Get Custom Slides by Experts
    Instantly Access Templates in PowerPoint

    Super Smart Charts PowerPoint Template


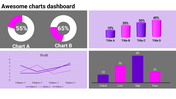
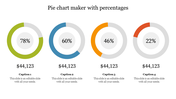
    SmartChart is an advanced charting tool that uses innovative technology to create dynamic and interactive visual representations of data, providing real-time updating, interactivity and customization options. Unlike traditional static charts, Smart Charts enable users to intuitively explore and analyze data, identifying trends, patterns and insights. Professionals in various fields such as business, finance, marketing, education and research can use this template to create dynamic presentations or reports, benefiting from fully editable templates with customizable smart charts. These charts improve audience engagement, emphasize key points, and make complex information easier to understand, ultimately leading to better decision-making and communication. By using this template, presenters can save time, provide useful insights and effectively communicate data-driven findings, encouraging informed decision-making and winning in their respective domains.

    Features of this template


    • 100% customizable slides and easy to download.
    • The slide contains 16:9 and 4:3 formats.
    • Easy to change the colors of the slide quickly.
    • Highly compatible with PowerPoint and Google Slides.
    Advertisement

    You May Also Like These PowerPoint Templates

    Free
    Add to Wishlist
    Download
    AI Customize
    Business growth chart with a bar graph for years 2018 to 2022, captions on the left, and a text block at the bottom.
    Add to Wishlist
    Download
    AI Customize
    Brand perception map illustrating consumer views on six brand tastes and natural qualities, with color coded labels.
    Add to Wishlist
    Download
    AI Customize
    A color-coded pie chart illustrating four data segments with values 15%, 20%, 30%, and 35%, paired with text captions.
    Add to Wishlist
    Download
    AI Customize
    Three-section KWL chart with bold headings in orange, pink, and purple columns, each containing placeholder text.
    Add to Wishlist
    Download
    AI Customize
    Butterfly chart with mirrored orange bars on either side, aligned symmetrically, and reducing in size towards the center.
    Add to Wishlist
    Download
    AI Customize
    Smart chart template slide showing bar and line charts labeled net profit alongside numbered caption area.
    Add to Wishlist
    Download
    AI Customize
    A bubble chart slide with four quadrants featuring colorful icons for key business strategies with a placeholder text area.
    Add to Wishlist
    Download
    AI Customize
    SmartArt pie chart showing 65% in red and 35% in green as a and b, with placeholder captions and a text box.
    Add to Wishlist
    Download
    AI Customize
    Radar PowerPoint Presentation Templates and Google Slides
    Add to Wishlist
    Download
    AI Customize
    Pentagon-shaped spider chart displaying two datasets in red and blue with two numbered caption areas.
    Add to Wishlist
    Download
    AI Customize
    Slide featuring a blue umbrella graphic with three labeled sections and two text boxes on the right.
    Add to Wishlist
    Download
    AI Customize
    Colorful pie chart with four segments in blue, purple, red, and orange, with matching text boxes showing percentages.
    Add to Wishlist
    Download
    AI Customize
    Editable Cockpit Charts PowerPoint Slide Template Design
    Add to Wishlist
    Download
    AI Customize
    Blank chart slide with a weekly layout from monday to sunday, featuring a grid for scheduling or organizing tasks.
    Free
    Add to Wishlist
    Download
    AI Customize
    Cute PowerPoint Radar Chart Templates For Presentation
    Add to Wishlist
    Download
    AI Customize
    Hoshin Kanri slide with a blue grid design labeled sections for annual objectives and a compass icon at the bottom.
    Free
    Add to Wishlist
    Download
    AI Customize
    Pie Chart Template Free Download PPT And Google Slides
    Add to Wishlist
    Download
    AI Customize
    Bar graph on a slide showing data from 2016 to 2019, with a title about statistics and a caption area section.