Affordable Break Even Analysis PowerPoint And Google Slides


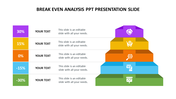

Creative Break Even Analysis PowerPoint Template
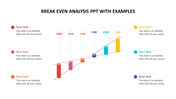
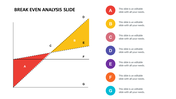
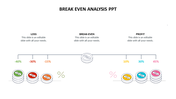
Break even analysis is a basic financial tool used by businesses to determine the point at which revenue equals costs, rather than profit or loss. It helps determine the minimum sales volume required to cover both fixed and variable costs, providing important insights into profitability and risk assessment. By analyzing the break-even point, businesses can make informed decisions about pricing strategies, production levels, and resource allocation, ultimately maximizing profits while minimizing potential losses. This template helps professionals in finance, business management, entrepreneurship, and strategic planning by providing customizable slide designs with clear charts, graphs, and tables to effectively present break-even calculations and concepts. With fully editable slides, users can adapt the template to their specific data and presentation style, ensuring clarity and engagement. Furthermore, it serves as a valuable resource for explaining break-even analysis principles, guiding decision-making processes, and improving financial management practices. By using this template, providers can simplify complex financial concepts, foster clear communication and confident decision making among stakeholders, thereby improving overall business strategies and outcomes.
Features of this template
- 100% customizable slides and easy to download.
- The slide contains 16:9 and 4:3 formats.
- Easy to change the colors of the slide quickly.
- Highly compatible with PowerPoint and Google Slides.


You May Also Like These PowerPoint Templates
Add to Wishlist
Download
AI Customize

Add to Wishlist
Download
AI Customize

Add to Wishlist
Download
AI Customize

Add to Wishlist
Download
AI Customize

Add to Wishlist
Download
AI Customize


Add to Wishlist
Download
AI Customize


Add to Wishlist
Download
AI Customize

Add to Wishlist
Download
AI Customize

Add to Wishlist
Download
AI Customize

Add to Wishlist
Download
AI Customize

Add to Wishlist
Download
AI Customize


Add to Wishlist
Download
AI Customize

Add to Wishlist
Download
AI Customize

Add to Wishlist
Download
AI Customize

Add to Wishlist
Download
AI Customize

Add to Wishlist
Download
AI Customize
