Customizable SIPOC PPT And Google Slides Template

Pack of 16 slides
P.ID : 73434
Advertisement
1.2K+ views
148 Downloads
Get Custom Slides by Experts
Instantly Access Templates in PowerPoint

SIPOC PPT, Google Slides And Canva Templates


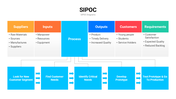
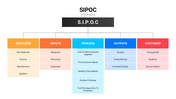
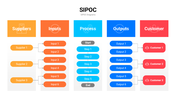
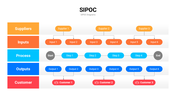
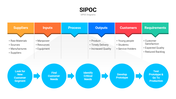
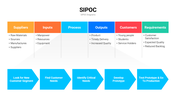
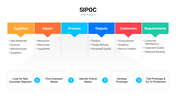
SIPOC (Suppliers, Inputs, Process, Outputs, Customers) is a high-level process mapping tool that provides a comprehensive overview of business workflows. It helps organizations identify the key elements of a process, ensuring clarity and alignment between stakeholders. By outlining these components, SIPOC enhances decision-making, process improvement, and operational efficiency.

Purpose Of The Slides

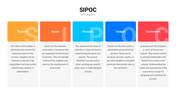
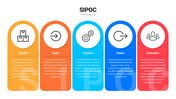
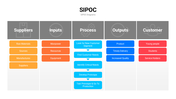
The slide is designed to visually explain the SIPOC framework, highlighting its core elements and their interconnections. The infographic layout simplifies complex process details, making it easier for professionals and students to grasp the concept. Whether it’s for analyzing workflows, identifying bottlenecks, or aligning team efforts, the slide provides a professional and engaging presentation format.

Who Can Use It?

Business professionals, process managers, consultants, educators, and students can utilize this slide effectively. It’s ideal for corporate presentations, classroom lectures, or workshops focused on process improvement, Lean methodologies, or Six Sigma projects.

Special Key Features

The SIPOC slide features a customizable format, allowing users to tailor content to their specific needs. The multicolor theme enhances visual engagement, while the professional design ensures key points are communicated clearly and concisely. Optimize your process mapping presentations with this SIPOC slide. Download it today to simplify workflows, align teams, and drive operational success.

Features of this template

  • 100% customizable slides and easy to download.
  • The slides contain 16:9 and 4:3 formats.
  • Easy to change the colors quickly.
  • Highly compatible with PowerPoint, Google Slides, and Canva templates.

You May Also Like These PowerPoint Templates

Add to Wishlist
Download
AI Customize
Add to Wishlist
Download
AI Customize
Add to Wishlist
Download
AI Customize
Add to Wishlist
Download
AI Customize
Slide with an orange upright and a purple inverted triangle, each featuring icons and four numbered captions around them.
Add to Wishlist
Download
AI Customize
Add to Wishlist
Download
AI Customize
 slide featuring three circular charts for data analysis, followed by a line chart displaying monthly trends.
Add to Wishlist
Download
AI Customize
Add to Wishlist
Download
AI Customize
Free
Add to Wishlist
Download
AI Customize
Competitor analysis chart slide comparing four companies across various categories.
Free
Add to Wishlist
Download
AI Customize
Vertical bar chart with five captions and a magnifying glass highlighting one, and numbered list with text on the right.
Add to Wishlist
Download
AI Customize
Slide featuring five colorful cylindrical bar charts labeled with data analytics categories with percentages from 23% to 75%.
Free
Add to Wishlist
Download
AI Customize
Add to Wishlist
Download
AI Customize
A market analysis slide featuring visual data representation with charts illustrating quantitative statistics with captions.
Add to Wishlist
Download
AI Customize
Hexagon layout with captions in teal, blue, and pink, connected to numbered nodes on a dotted gray background.
Add to Wishlist
Download
AI Customize
Five numbered hexagons in red, orange, green, teal, and blue, each with text inside.