Scrum Master Vs Product Owner PowerPoint And Google Slides

Pack of 11 slides
P.ID : 74016
Advertisement
21 views
5 Downloads
Get Custom Slides by Experts
Instantly Access Templates in PowerPoint

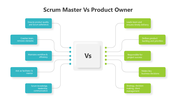
Scrum Master Vs Product Owner PowerPoint, Google Slides, and Canva Template


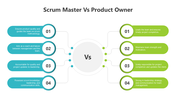
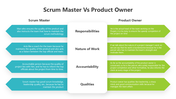
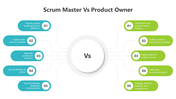
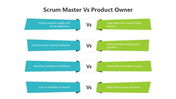
The Scrum Master ensures Agile processes run smoothly, removes obstacles, and facilitates team collaboration. The Product Owner defines product vision, prioritizes the backlog, and aligns business goals with development. While the Scrum Master focuses on process efficiency, the Product Owner drives product strategy, ensuring valuable outcomes for stakeholders.


Purpose Of The Slides

This 11-slide presentation deck, designed with a multicolor theme, provides a clear and structured comparison of the Scrum Master vs Product Owner roles. The slides cover key differences, responsibilities, and collaboration strategies, making it an ideal resource for Agile teams, project managers, and Scrum practitioners.


Who Can Use It?

  • Scrum Masters & Agile Coaches – To train teams on Scrum methodologies.
  • Product Owners & Business Analysts – To define and manage product requirements.
  • Project Managers & Developers – To understand Agile workflow and team roles.
  • Organizations & Startups – To implement Scrum effectively.

  • Special Key Features

    Download this Scrum Master vs Product Owner PowerPoint template to create an insightful presentation on Agile roles, responsibilities, and Scrum best practices.


    Features of this template

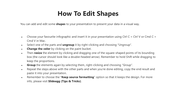
    • 100% customizable slides and easy to download.
    • The slides contain 16:9 and 4:3 formats.
    • Easy to change the colors quickly.
    • Highly compatible with PowerPoint, Google Slides, and Canva templates.

    You May Also Like These PowerPoint Templates

    Free
    Add to Wishlist
    Download
    AI Customize
    A split layout with green and white, each displaying a bar chart, with icons and text below.
    Add to Wishlist
    Download
    AI Customize
    Slide with comparative icons and percentage values in circular designs for various templates, with placeholder text areas.
    Add to Wishlist
    Download
    AI Customize
    Product comparison table slide with a green section highlighting advantages and a red section showing disadvantages.
    Add to Wishlist
    Download
    AI Customize
    Pricing comparison table with four columns for silver, gold, diamond, and platinum plans, each showing a monthly price.
    Add to Wishlist
    Download
    AI Customize
    Structured chart comparing blockchain types using gold bordered boxes and bullet points for detailed characteristics.
    Add to Wishlist
    Download
    AI Customize
    Demographic comparison slide with red male and blue female icon, with percentage values and text areas below each.
    Add to Wishlist
    Download
    AI Customize
    A PowerPoint slide comparing two IT services managed services and vDoctor, with key features and benefits highlighted.
    Add to Wishlist
    Download
    AI Customize
    Structured layout featuring four rows of paired colored circles and corresponding gray text boxes on a white background.
    Add to Wishlist
    Download
    AI Customize
    Comparison slide with two interlocked triangles in orange and blue, paired with captions on both sides.
    Add to Wishlist
    Download
    AI Customize
    Comparison diagram showing the connection between logistics 4.0 and industry 4.0, with shared elements in the center.
    Free
    Add to Wishlist
    Download
    AI Customize
    Creative ideas slide featuring two brain illustrations on blue scale base, highlighting balance between seeing and thinking.
    Add to Wishlist
    Download
    AI Customize
    Gender symbols chart slide with two sections displaying groups of male and female icons, each with percentage markers.
    Add to Wishlist
    Download
    AI Customize
    Cause and effect PowerPoint slide with three rows of paired text boxes and icons in orange, blue, and red colors.
    Add to Wishlist
    Download
    AI Customize
    Cause and effect diagram with two large arrows in red and blue, each linked to icons in colored boxes.
    Free
    Add to Wishlist
    Download
    AI Customize
    Comparison slide with male icon in Circle A and female icon in Circle B, flanked by steps 01 and 02 on both sides.
    Add to Wishlist
    Download
    AI Customize
    Comparison PPT slide featuring colorful icons of people with different percentages, illustrating a gender based comparison.
    Add to Wishlist
    Download
    AI Customize
    Force field template with driving and restricting forces each with a colored box and placeholder text areas.