Scientific Method Flow Chart PowerPoint & Google Slides
Scientific Method Flow Chart Presentation Slide
Are you struggling with the scientific method and how to apply it in your research? Look no further than the scientific method flow chart! This visual aid simplifies the scientific method process into a clear, step-by-step flowchart, making it easier to understand and follow. It involves identifying a problem or question, forming a hypothesis, conducting experiments to test the hypothesis, analyzing data, and drawing conclusions. Our pre-made template provides an aesthetically pleasing design that is customizable to fit your research needs. With this flowchart, you can easily organize your scientific research process and present it in a clear and concise manner.
Features of the template
- 100% customizable slides and easy to download.
- Slides are available in different nodes & colors.
- The slide contains 16:9 and 4:3 formats.
- Easy to change the colors of the slide quickly.
- Well-crafted template with an instant download facility.
- Highly compatible with PowerPoint and Google Slides.
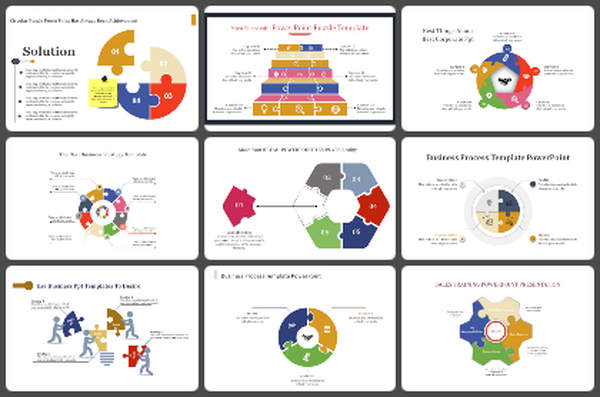
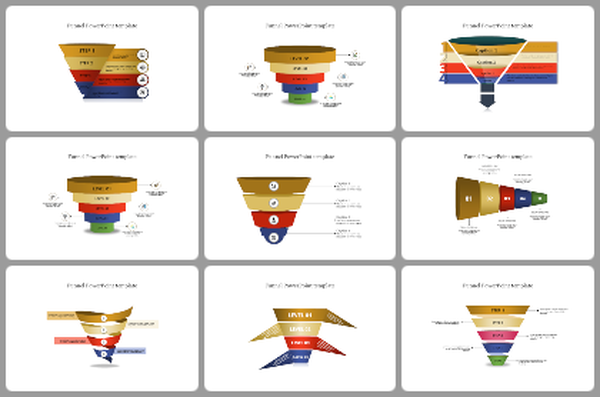
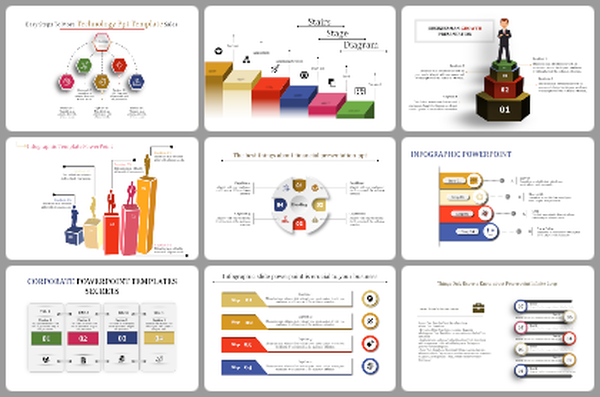
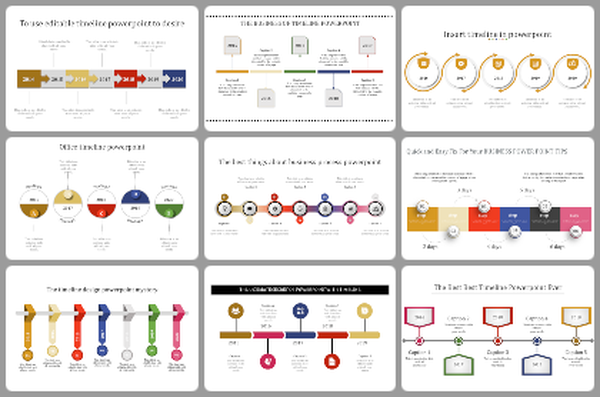
- It has a colorful flowchart.
- It looks neat and perfectly organized.
You May Also Like These PowerPoint Templates
Free
Free
Free


