Customized Sales Report Template Presentation Designs

Sales report PPT template featuring a computer screen with data, charts, and colorful icons.
P.ID : 22038
    333 views
    35 Downloads
    Get Custom Slides by Experts
    Instantly Access Templates in PowerPoint

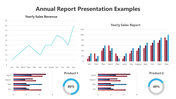
    Innovative Sales Report Presentation

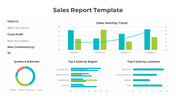
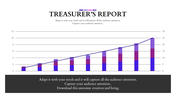
    Giving executives a broad image of their company's concerns from top to bottom will help you successfully develop your business growth plan. The computer monitor is also employed in decision-making and trend study. This six-noded sales report template will allow you to correctly survey your business's cash flow. It will assist you in making the process less tricky and time-consuming because you can quickly alter the slides to suit your aesthetic needs and sets.

    Features of this template

    •  100% customizable slides and easy to download.
    •  Slides available in different nodes & colors.
    •  The slide contained 16:9 and 4:3 format.
    •  Easy to change the slide colors quickly.
    •  Well-crafted template with instant download facility.
    •  Huge colorful video protection slides to impress your audience
    Advertisement

    You May Also Like These PowerPoint Templates

    Free
    Add to Wishlist
    Download
    AI Customize
    Graphic displaying annual report sheets, a colorful bar chart, green blocks and a pink magnifying glass.
    Add to Wishlist
    Download
    AI Customize
    A monthly PowerPoint template displaying colorful wave like graphs for each month from January to June with placeholder text.
    Free
    Add to Wishlist
    Download
    AI Customize
    Slide with a colorful circular chart divided into orange, green, red, and blue segments, centered with a black bar chart.
    Add to Wishlist
    Download
    AI Customize
    Horizontal table with metric labels in colorful blocks on the left and status bars with descriptions on the right.
    Add to Wishlist
    Download
    AI Customize
    Effective Business Report Sample PPT Presentation Slide
    Add to Wishlist
    Download
    AI Customize
    Quarterly report slide with a vertical red arrow marking Q1 to Q4 in colorful circles and text rows on a teal background.
    Add to Wishlist
    Download
    AI Customize
    Six-step supply chain process with hexagonal segments connected by a timeline, from raw materials to purchase.
    Add to Wishlist
    Download
    AI Customize
    Project status report template with a timeline graph from 2016 to 2025 and colored bars indicating monthly progress.
    Add to Wishlist
    Download
    AI Customize
    Medical icons arranged in square buttons on the left, with case report bullet points on the right in a green background.
    Add to Wishlist
    Download
    AI Customize
    Organized weekly planner with days listed in blue tabs and an illustration of two people planning.
    Add to Wishlist
    Download
    AI Customize
    Annual report slide featuring a financial summary with categories, budget, expenses, and net earnings in a table format.
    Add to Wishlist
    Download
    AI Customize
    Survey results show percentage breakdowns for categories with corresponding figures and brief descriptions.
    Add to Wishlist
    Download
    AI Customize
    Annual report template featuring financial metrics, performance comparisons, and graphical data visualizations.
    Add to Wishlist
    Download
    AI Customize
    Financial report slide with key performance indicators along with additional metrics showing divident and ratio.
    Add to Wishlist
    Download
    AI Customize
    Annual report slide with five sections of pie chart, bar graphs, and profit figures, in green and blue tones.
    Add to Wishlist
    Download
    AI Customize
    Slide featuring a central monochrome document icon with captions, surrounded by four images showcasing data analysis scenes.
    Add to Wishlist
    Download
    AI Customize
    Best Infographic Survey PowerPoint Template
    Add to Wishlist
    Download
    AI Customize
    Business report template with a monthly timeline chart and three pie charts below with percentages segments.
    Add to Wishlist
    Download
    AI Customize
    Sales performance review slide with key metrics such as revenue, new customers, gross profit, and customer satisfaction.