Creative Sales Report Presentation Slide With Graph

Graphical representation of annual sales data, with emphasis on financial growth percentages and highlighted bars.
P.ID : 56363
    806 views
    108 Downloads
    Get Custom Slides by Experts
    Instantly Access Templates in PowerPoint

    Bar Graph Slide To Present Your Sales Activities


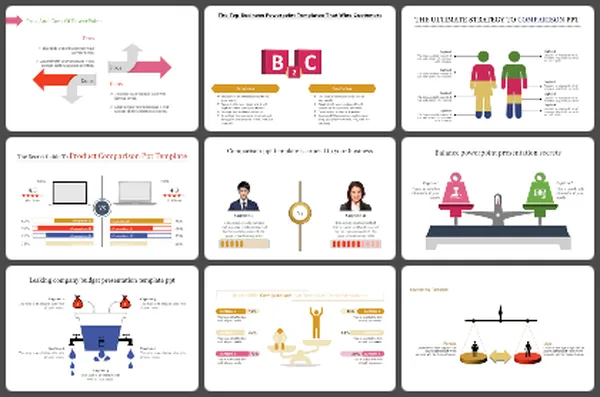
    A sales report will serve as the best sales analysis tool. It will help you measure your progress, determine your success, define your target audience, and more. SlideEgg offers this well-made sales report presentation template to present and analyze the sales activities. It has a brilliant layout with a bar graph, More...
    Advertisement

    You May Also Like These PowerPoint Templates

    Add to Wishlist
    Download
    AI Customize
    Comparison of total sales revenue slide for USA, chile, and austria, featuring a bar chart and a world map with percentages.
    Add to Wishlist
    Download
    AI Customize
    Bar chart showing sales performance from 2014 to 2021 with red and blue vertical bars indicating different percentages.
    Add to Wishlist
    Download
    AI Customize
    Sales Report PowerPoint Template and Google Slides
    Add to Wishlist
    Download
    AI Customize
    Sales performance review slide with key metrics such as revenue, new customers, gross profit, and customer satisfaction.
    Add to Wishlist
    Download
    AI Customize
    Sales report PowerPoint slide with bar charts depicting sales, cost, profit, and cash flow over two years.
    Add to Wishlist
    Download
    AI Customize
    Sales Budget Sample PPT With Pie Chart Diagram Slide
    Add to Wishlist
    Download
    AI Customize
    Sales turnover report slide with three icons in diamond shapes on the left and three numbered placeholders text areas.
    Add to Wishlist
    Download
    AI Customize
    Sample sales report featuring three pie charts and a calendar table with colored bars across different months.
    Free
    Add to Wishlist
    Download
    AI Customize
    Four vertical pointed icons in red, blue, purple, and orange, each aligned with caption on a light background.
    Add to Wishlist
    Download
    AI Customize
    Sales report infographic slide comparing male and female sales figures for mobile devices and desktop computers.
    Add to Wishlist
    Download
    AI Customize
    Colorful bar chart representing sales trends from 2018 to 2021, alongside a donut chart showing 80% market share.
    Add to Wishlist
    Download
    AI Customize
    Sales report slide showing metrics like sales volume, profit margin, and a gauge chart along with a bar graph.
    Free
    Add to Wishlist
    Download
    AI Customize
    Sales performance review template with five pentagon sections from governance to field sales each with caption area.
    Add to Wishlist
    Download
    AI Customize
    Sales report slide featuring a multicolored area chart from 2016 to 2020 with product data on the side.
    Add to Wishlist
    Download
    AI Customize
    Bar chart slide illustrating sales turnover report across six violet categories, showcasing varying levels of turnover.
    Add to Wishlist
    Download
    AI Customize
    3D sales chart displaying a 60 percent sales progress with an informative text section and interactive button on blue theme.
    Add to Wishlist
    Download
    AI Customize
    Sales report slide with key metrics and multiple charts illustrating from monthly trends to quote status.
    Free
    Add to Wishlist
    Download
    AI Customize
    Slide design for sales performance, with six circular icons in a circular pattern, each labeled with captions areas.
    Add to Wishlist
    Download
    AI Customize
    Sales performance dashboard template in red displaying revenue, recent sales, user data, and session metrics visually.