Excellent Sales Performance Review PPT And Google Slides

Sales performance review slide with key metrics such as revenue, new customers, gross profit, and customer satisfaction.
P.ID : 35813
    2K+ views
    708 Downloads
    Get Custom Slides by Experts
    Instantly Access Templates in PowerPoint

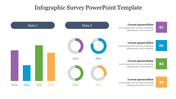
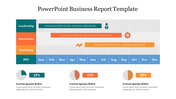
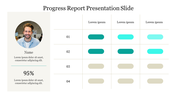
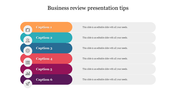
    Sales Performance Review PowerPoint Template


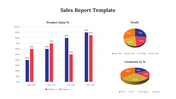
    A sales performance review is a systematic evaluation of sales activities and results. It analyzes metrics such as revenue, customer acquisition, and conversion rates to assess performance, identify areas for improvement, and drive revenue growth. Sales managers, team leaders, and business executives can utilize this template to conduct comprehensive sales performance reviews and communicate results effectively.  It provides a visually appealing and organized platform to present sales performance data, trends, and analysis, facilitating clear communication and strategic planning. Our PowerPoint template features fully editable slides, allowing customization to suit specific review needs and preferences. this template has include editable charts and graph. Presenters benefit from its user-friendly design and comprehensive content, enabling impactful presentations and discussions. Download now to streamline your sales performance evaluation process and drive success with data-driven decision-making. 


    Features of this template


    • 100% customizable slides and easy to download.
    • The slide contains 16:9 and 4:3 formats.
    • Easy to change the colors of the slide quickly.
    • Highly compatible with PowerPoint and Google Slides.
    Advertisement

    You May Also Like These PowerPoint Templates

    Add to Wishlist
    Download
    AI Customize
    A teal status report slide with a donut chart showing percentages and a table on the right detailing project phases.
    Add to Wishlist
    Download
    AI Customize
    Infographic displaying social media engagement metrics alongside a business-themed illustration.
    Add to Wishlist
    Download
    AI Customize
    Table showing monthly sales data for 2020 with targets, percentage achieved, and status using colored arrows.
    Add to Wishlist
    Download
    AI Customize
    Eye-catching Red PowerPoint Design Slide Templates
    Add to Wishlist
    Download
    AI Customize
    A colorful Monday weekly planner slide with hourly slots from 7.00 AM to 1.00 PM, a to do list, and text sections.
    Add to Wishlist
    Download
    AI Customize
    Company report slide with a diagonal split design, featuring a tablet displaying analytics and two percentage data sections.
    Add to Wishlist
    Download
    AI Customize
    Work report slide showing hands typing on a laptop, with a coffee cup, notebook, phone, and headphones on a wooden table.
    Add to Wishlist
    Download
    AI Customize
    Investment PPT slide with progress bars representing various areas from the facility and machine web digital solutions.
    Add to Wishlist
    Download
    AI Customize
    Weekly report layout PowerPoint slide featuring days of the week and a calendar with placeholder text on a white backdrop.
    Add to Wishlist
    Download
    AI Customize
    Sales report slide with a world map and a ranking table on the right, listing branches, countries, sales, and managers.
    Add to Wishlist
    Download
    AI Customize
    Cute weekly schedule design featuring colorful sticky notes for Monday to Sunday on a purple backdrop.
    Add to Wishlist
    Download
    AI Customize
    A PPT slide showing survey results with bar graphs and financial data on a laptop screen with placeholder text.
    Add to Wishlist
    Download
    AI Customize
    Product sales report slide with a gray monitor illustration and six labeled icons for different item categories.
    Free
    Add to Wishlist
    Download
    AI Customize
    Two percentage sections with construction site images with workers, and a text with title on the right.
    Add to Wishlist
    Download
    AI Customize
    A 3D pie chart with purple, blue, green, teal, and orange segments showing company annual expenses in various categories.
    Add to Wishlist
    Download
    AI Customize
    3D triangular bar chart in yellow, orange, and blue shades showing monthly data for four categories, on a dark background.
    Add to Wishlist
    Download
    AI Customize
    Infographic with bar graphs in red, purple, yellow, and orange emerging from a smartphone, representing monetary values.
    Add to Wishlist
    Download
    AI Customize
    A weekly report layout with colored headers for each day of the week and space for tasks.