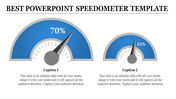
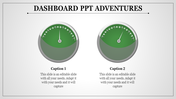
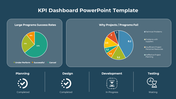
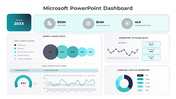
Sales Performance Dashboard PPT Slide Templates

 Canva
Canva
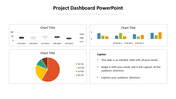
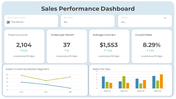
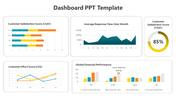

Revolutionize With Our Sales Performance Dashboard Templates
In today's busiest business landscape, staying ahead of the competition requires precise and timely insights into your sales performance. That's where Sales Performance Dashboard templates come into play. Our templates offer a comprehensive overview of your sales activities in one centralized location. Visualize critical data points such as revenue, customer acquisition, conversion rates, and sales pipeline progression through intuitive charts, graphs, and KPI widgets. Tailor the nodes to align with your specific business goals, branding, and reporting requirements. These sales dashboards also foster collaboration and transparency among your sales team. With a single click, you can import and analyze data from your CRM, saving time and reducing errors. Revamp your sales strategy and supercharge your performance with our Sales Performance Dashboard templates.
Features of this template
- 100% customizable slides and easy to download
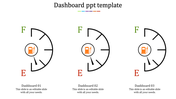
- Slides are available in different nodes & colors.
- The slides contain 16:9 and 4:3 formats.
- Easy to change the slide colors quickly.
- Innovative nodes are presented.
- Available at an affordable cost.
- Compatible with google slides and MS Word.
- Highly compatible with PowerPoint, Google Slides and Canva template.


You May Also Like These PowerPoint Templates
Add to Wishlist
Download
AI Customize

Add to Wishlist
Download
AI Customize

Add to Wishlist
Download
AI Customize

Add to Wishlist
Download
AI Customize

Add to Wishlist
Download
AI Customize

Add to Wishlist
Download
AI Customize

Add to Wishlist
Download
AI Customize


Add to Wishlist
Download
AI Customize


Add to Wishlist
Download
AI Customize

Add to Wishlist
Download
AI Customize

Add to Wishlist
Download
AI Customize

Add to Wishlist
Download
AI Customize

Add to Wishlist
Download
AI Customize

Free
Add to Wishlist
Download
AI Customize

Add to Wishlist
Download
AI Customize

Add to Wishlist
Download
AI Customize

Add to Wishlist
Download
AI Customize

