The Risk Vs Benefits PowerPoint And Google Slides

 Canva
Canva

Risk Vs Benefits PPT, Google Slides, and Canva Template
When making decisions, especially in business, health, or strategic planning, it's important to balance risks against benefits. Risk vs benefits analysis is a key decision-making tool that helps you assess potential downsides and possible gains to determine the best course of action. By visualizing the risks and benefits, you can make more informed, calculated choices that lead to long-term success.
Purpose Of The Slides
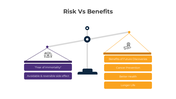
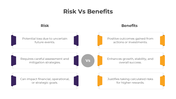
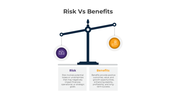
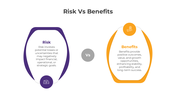
The Risk vs Benefits template helps you present a clear comparison of the potential risks and rewards associated with a decision or action. It illustrates how risks, such as financial loss or operational disruptions, compare to benefits like long-term growth, better health, or increased profits. This tool aids in understanding whether the potential rewards outweigh the risks, guiding leaders in making strategic decisions.
Who Can Use It?
- Business professionals evaluating investments or strategic decisions.
- Health and safety officers assessing medical treatments or interventions.
- Project managers compare the pros and cons of different project plans.
- Students and educators studying decision-making models and risk management techniques.
Special Key Features
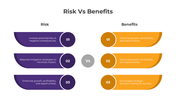
This Risk vs Benefits template is easy to customize, visually engaging, and provides a structured way to present complex trade-offs. The multicolor design allows for clear visualization, making it perfect for presentations to stakeholders, decision-makers, or teams.
Download the Risk vs Benefits template today and start making better, data-driven decisions!
Features of this template
- 100% customizable slides and easy to download.
- The slides contain 16:9 and 4:3 formats.
- It is easy to change the colors quickly.
- Highly compatible with PowerPoint, Google Slides, and Canva templates.


You May Also Like These PowerPoint Templates
Add to Wishlist
Download
AI Customize

Free
Add to Wishlist
Download
AI Customize

Add to Wishlist
Download
AI Customize

Add to Wishlist
Download
AI Customize

Add to Wishlist
Download
AI Customize

Add to Wishlist
Download
AI Customize

Add to Wishlist
Download
AI Customize

Add to Wishlist
Download
AI Customize

Add to Wishlist
Download
AI Customize

Add to Wishlist
Download
AI Customize

Add to Wishlist
Download
AI Customize

Add to Wishlist
Download
AI Customize

Add to Wishlist
Download
AI Customize

Add to Wishlist
Download
AI Customize


Add to Wishlist
Download
AI Customize

Add to Wishlist
Download
AI Customize

Add to Wishlist
Download
AI Customize

Add to Wishlist
Download
AI Customize

