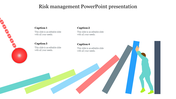
Our Predesigned Risk Management PowerPoint Template

Risk analysis slide shows a table with the market, credit, liquidity, and legal risks along with their values.
P.ID : 5515
    3.2K+ views
    116 Downloads
    Get Custom Slides by Experts
    Instantly Access Templates in PowerPoint

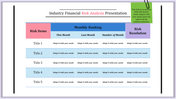
    Functional Financial Risk Template


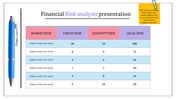
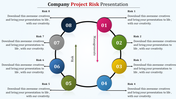
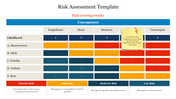
    Our financial risk assessment template will assist you in determining the risk level specific to your business, prioritizing those risks, developing ways to avoid them, and outlining steps to manage them. In short, a financial risk assessment template helps you understand your appetite for risk and aid you in discussing it with your colleagues. This template is filled with many animations encouraging you to bring out many facts. The chart presented also holds the readymade contents, so if you want, you can alter it anytime using the options. So, get this amicable template right now!

    Features of this template

    • 100% customizable slides and easy to download
    • Slides are available in different nodes & colors.
    • The slides contained 16:9 and 4:3 formats.
    • Easy to change the slide colors quickly.
    • Well-crafted template with an instant download facility.
    • Spacious nodes on all sides.
    • Available at the lowest cost.
    Advertisement

    You May Also Like These PowerPoint Templates

    Add to Wishlist
    Download
    AI Customize
    Risk management slide with a colored circle divided four numbered sections, each with icons and text around it.
    Free
    Add to Wishlist
    Download
    AI Customize
    A table with a green header and alternating white and gray rows, presenting project risk data in a structured format.
    Add to Wishlist
    Download
    AI Customize
    Heat map slide displaying probability versus severity with color coded risk levels ranging from low to extreme with text.
    Add to Wishlist
    Download
    AI Customize
    Four step risk assessment plan slide highlighting avoidance, transfer, reduction, and prioritization with colorful labels.
    Add to Wishlist
    Download
    AI Customize
    Risk assessment flowchart slide explaining three steps with colorful icons and text captions of mitigation strategies.
    Add to Wishlist
    Download
    AI Customize
    Slide pack with a circular diagram, timeline, analysis steps, and segmented workflow in various colors.
    Add to Wishlist
    Download
    AI Customize
    Four rounded rectangles in yellow, teal, red, and blue, each labeled with a risk management process steps.
    Add to Wishlist
    Download
    AI Customize
    Risk management visual slide with charts representing data distribution across various departments and failure categories.
    Add to Wishlist
    Download
    AI Customize
    Circular diagram with six sections connected to a central checklist icon, showing risk management steps in gray tones.
    Add to Wishlist
    Download
    AI Customize
    TPRM PowerPoint Presentation And Google Slides Themes
    Add to Wishlist
    Download
    AI Customize
    Slide showcasing supplier quality assurance concepts, highlighting strategic vision and supplier risk assessment.
    Add to Wishlist
    Download
    AI Customize
    Risk diagram with a central green sphere and four surrounding arrows in blue, red, yellow, and pink pointing towards it.
    Free
    Add to Wishlist
    Download
    AI Customize
    Four-part circular design in purple with icons representing different risk factors, alongside placeholder text.
    Add to Wishlist
    Download
    AI Customize
    Three colored boxes in red, blue, and orange, indicating mitigation strategies, connected by arrows on a white background.
    Add to Wishlist
    Download
    AI Customize
    Graphical matrix displaying three colored circles in green, and red gradient, placed on a blue grid background.
    Add to Wishlist
    Download
    AI Customize
    Risk and issue management process with five stages in colored boxes and central communication box above.
    Free
    Add to Wishlist
    Download
    AI Customize
    Bar graph displaying risk levels for six activities, with colored markers from high to low risk with caption areas.