Risk Management KPI PowerPoint And Google Slides Themes

Risk Management KPI template with data tables, pie chart, bar graph, trend analysis, control metrics, and placeholders.
P.ID : 73939
    39 views
    5 Downloads
    Get Custom Slides by Experts
    Instantly Access Templates in PowerPoint

    Risk Management KPI PowerPoint, Google Slides and Canva Templates


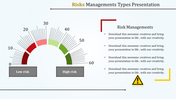
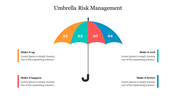
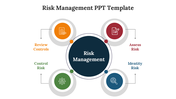
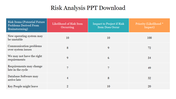
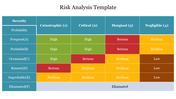
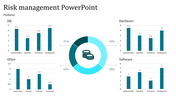
    Risk Management KPI (Key Performance Indicators) are essential metrics used to evaluate, monitor, and enhance an organization's risk management strategies. These indicators help businesses assess financial risks, operational vulnerabilities, compliance adherence, and overall risk exposure. Common risk KPIs include incident frequency, risk mitigation effectiveness, regulatory compliance rates, and financial risk ratios. By tracking these KPIs, companies can improve decision-making, enhance risk control frameworks, and ensure long-term sustainability.


    Purpose Of The Slides

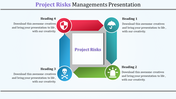
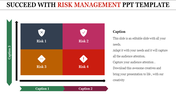
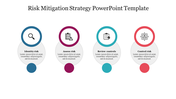
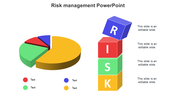
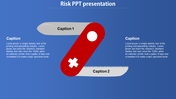
    This single-slide presentation, designed with a multicolor theme, provides a clear and concise overview of Risk Management KPIs. The slide covers key risk indicators, performance measurement strategies, and best practices for optimizing risk assessment. With a fully customizable layout, this deck is ideal for professionals aiming to strengthen their organization's risk management process.


    Who Can Use It?

  • Risk Managers & Compliance Officers – To assess and enhance risk control strategies.
  • Business Executives & Decision-Makers – To monitor key risk indicators for financial stability.
  • Internal Auditors & Governance Teams – To track regulatory compliance and risk mitigation success.
  • Financial Analysts & Consultants – To evaluate risk exposure and forecast risk trends.

  • Special Key Features 

    Download this Risk Management KPI PowerPoint template to create a data-driven presentation on risk performance measurement, KPI analysis, and risk management improvements.


    Features of this template


    • 100% customizable slides and easy to download.
    • The slide contains 16:9 and 4:3 formats.
    • Easy to change the colors of the slide quickly.
    • Highly compatible with PowerPoint, Google Slides, and Canva templates.
    Advertisement

    You May Also Like These PowerPoint Templates

    Add to Wishlist
    Download
    AI Customize
    Risk management PowerPoint template showing a cycle of risk identification to tracking with icons and placeholder text.
    Add to Wishlist
    Download
    AI Customize
    Project risk slide featuring a circular flowchart with eight colorful nodes, each labeled with a risk number.
    Add to Wishlist
    Download
    AI Customize
    Risk PPT template featuring a businessperson surrounded by six lit bombs arranged in a semicircle.
    Add to Wishlist
    Download
    AI Customize
    A colorful risk analysis matrix slide chart, displaying low, medium, high, and extreme risk levels in a grid format.
    Free
    Add to Wishlist
    Download
    AI Customize
    Two green text banners showcasing steps of risk analysis and management with icons and two caption areas.
    Add to Wishlist
    Download
    AI Customize
    Matrix diagram of risk management with colored blocks indicating risk levels across low to high likelihood and consequence.
    Add to Wishlist
    Download
    AI Customize
    Risk management slide with four labeled risks represented by icons in a step by step process with placeholder text.
    Add to Wishlist
    Download
    AI Customize
    Risk analysis slide shows a table with the market, credit, liquidity, and legal risks along with their values.
    Add to Wishlist
    Download
    AI Customize
    Project risk management PowerPoint slide with three risks and corresponding captions and colorful diamonds.
    Add to Wishlist
    Download
    AI Customize
    A chart outlining six colored risk levels, with corresponding descriptions and prevention measures in a table format.
    Add to Wishlist
    Download
    AI Customize
    Graphical matrix displaying three colored circles in green, and red gradient, placed on a blue grid background.
    Add to Wishlist
    Download
    AI Customize
    A line graph showing seven activities with colored data points ranging from red to gray, next to a color coded impact scale.
    Add to Wishlist
    Download
    AI Customize
    Semi-circle diagram with four segments labeled identify, assess, control, and review risks.
    Add to Wishlist
    Download
    AI Customize
    Risk management template showing a gear icon in the center, surrounded by green and red process segments.
    Add to Wishlist
    Download
    AI Customize
    Heat map slide displaying probability versus severity with color coded risk levels ranging from low to extreme with text.