Compare Renting Vs Owning PowerPoint And Google Slides

Pack of 13 slides
P.ID : 73738
Advertisement
52 views
7 Downloads
Get Custom Slides by Experts
Instantly Access Templates in PowerPoint

Renting Vs Owning PPT, Google Slides, and Canva Template


Renting Vs Owning is a financial decision that impacts long-term stability, investment potential, and lifestyle choices. Renting offers flexibility, lower upfront costs, and fewer maintenance responsibilities, making it ideal for those who prefer mobility. Owning a home, on the other hand, builds equity, provides long-term financial security, and offers personal customization. Understanding the pros and cons of renting vs owning helps individuals make informed choices based on financial goals, market conditions, and personal preferences.

Purpose Of The Slides

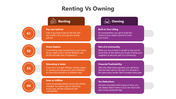
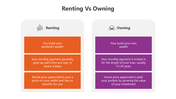
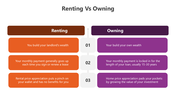
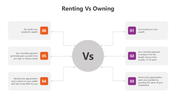
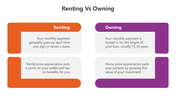
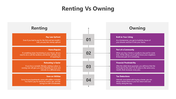
This 13-slide deck is designed to help users analyze the financial and lifestyle aspects of renting and owning a home. With a multicolor theme, this template is easy to customize and is ideal for real estate presentations, financial planning discussions, and decision-making guidance. The slides include sections for cost comparison, investment potential, tax benefits, flexibility, and homeownership responsibilities, making it a structured and informative resource.


Who Can Use It?

  • Homebuyers and renters evaluating housing options.
  • Real estate agents presenting property investment insights.
  • Financial advisors guiding clients on housing affordability.
  • Educators and students exploring real estate market trends.
  • Property investors analyzing long-term financial benefits.

Special Key Features

Download this Renting Vs Owning PowerPoint template to create engaging, insightful, and data-driven presentations. Designed for homebuyers, real estate professionals, and financial consultants, this template ensures clarity, structured content, and valuable insights to help individuals make informed housing decisions.


Features of this template


  • 100% customizable slides and easy to download.
  • The slides contain 16:9 and 4:3 formats.
  • It is easy to change the colors quickly.
  • Highly compatible with PowerPoint, Google Slides, and Canva templates.

You May Also Like These PowerPoint Templates

Add to Wishlist
Download
AI Customize
Slide with comparative icons and percentage values in circular designs for various templates, with placeholder text areas.
Add to Wishlist
Download
AI Customize
Add to Wishlist
Download
AI Customize
Pricing comparison table with four columns for silver, gold, diamond, and platinum plans, each showing a monthly price.
Add to Wishlist
Download
AI Customize
Product comparison table slide with a green section highlighting advantages and a red section showing disadvantages.
Add to Wishlist
Download
AI Customize
Add to Wishlist
Download
AI Customize
Comparison diagram showing the connection between logistics 4.0 and industry 4.0, with shared elements in the center.
Add to Wishlist
Download
AI Customize
Gender symbols chart slide with two sections displaying groups of male and female icons, each with percentage markers.
Add to Wishlist
Download
AI Customize
A PowerPoint slide comparing two IT services managed services and vDoctor, with key features and benefits highlighted.
Add to Wishlist
Download
AI Customize
Structured chart comparing blockchain types using gold bordered boxes and bullet points for detailed characteristics.
Add to Wishlist
Download
AI Customize
Structured layout featuring four rows of paired colored circles and corresponding gray text boxes on a white background.
Free
Add to Wishlist
Download
AI Customize
A split layout with green and white, each displaying a bar chart, with icons and text below.
Free
Add to Wishlist
Download
AI Customize
Comparison slide with male icon in Circle A and female icon in Circle B, flanked by steps 01 and 02 on both sides.
Free
Add to Wishlist
Download
AI Customize
Creative ideas slide featuring two brain illustrations on blue scale base, highlighting balance between seeing and thinking.
Add to Wishlist
Download
AI Customize
Cause and effect PowerPoint slide with three rows of paired text boxes and icons in orange, blue, and red colors.
Add to Wishlist
Download
AI Customize
Add to Wishlist
Download
AI Customize
Demographic comparison slide with red male and blue female icon, with percentage values and text areas below each.
Add to Wishlist
Download
AI Customize
Force field template with driving and restricting forces each with a colored box and placeholder text areas.