Elegant Quantitative Research Methods PPT And Google Slides

Pack of 11 slides
P.ID : 71792
Advertisement
647 views
95 Downloads
Get Custom Slides by Experts
Instantly Access Templates in PowerPoint

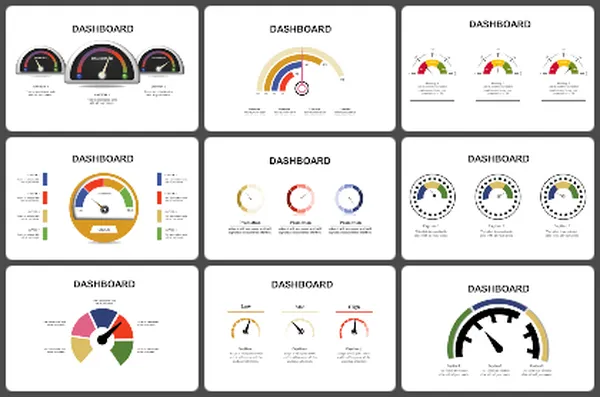
Quantitative Research Methods Presentation Slides


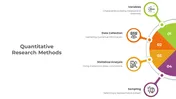
Quantitative Research Methods form the bedrock of empirical investigation, involving systematic collection and analysis of numerical data to draw statistically significant conclusions. This approach provides a structured framework for hypothesis formulation, experimental design, and rigorous statistical analysis. By quantifying phenomena, researchers gain crucial insights into variable relationships, facilitating evidence-based decision-making. Applicable across diverse fields, from social sciences to economics, it offers a robust means of generating reliable, replicable findings. The Change Management PowerPoint template is tailored for change leaders, managers, and professionals, offering an indispensable tool for guiding organizations More...

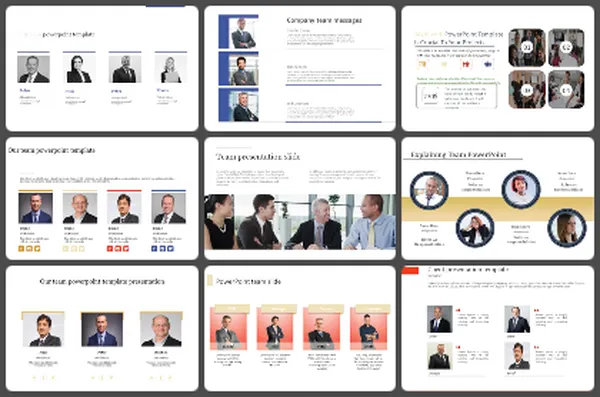
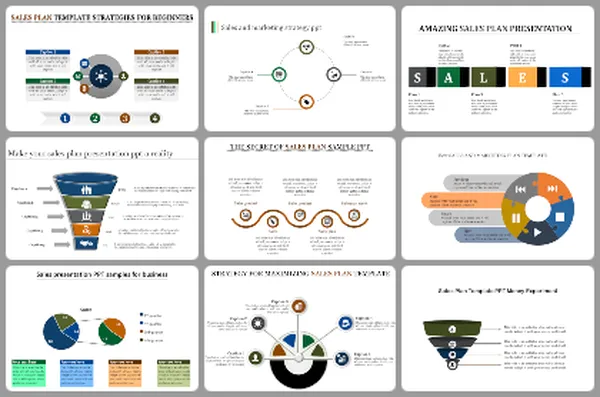
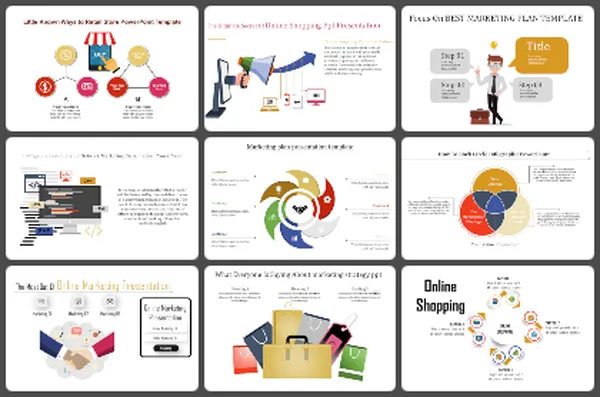
You May Also Like These PowerPoint Templates

Add to Wishlist
Download
AI Customize
An upward-branching diagram from a house icon with four sections representing different steps, each marked by a icon.
Add to Wishlist
Download
AI Customize
Slide with four donut charts in green, blue, orange, and yellow, each filled by icons and captions area.
Add to Wishlist
Download
AI Customize
Ethnography objectives slides with four colorful sections and different layout designs with icons and text descriptions.
Add to Wishlist
Download
AI Customize
Research template featuring a magnifying glass and four colored sections with placeholder text areas.
Add to Wishlist
Download
AI Customize
World map with six orange location markers and a left-side orange panel containing placeholder text.
Add to Wishlist
Download
AI Customize
Market research slide with four circular charts in blue, green, red, and purple, each showing percentages and icons.
Free
Add to Wishlist
Download
AI Customize
Slide with colorful teardrop shapes in black, red, blue, orange, and pink, each containing an icon to represent a process.
Add to Wishlist
Download
AI Customize
Six step research slide deck featuring circular, colorful numbered icons, with sections detailing each stage.
Free
Add to Wishlist
Download
AI Customize
Central circular icon with eight color coded blocks arranged on either side, connected by dotted lines.
Add to Wishlist
Download
AI Customize
Horizontal bars in green, yellow, blue, and purple, paired with icons, indicating progress percentages in a clean layout.
Add to Wishlist
Download
AI Customize
Four colored caption boxes linked to green, yellow, blue, and red circular icons, forming part of a segmented circular chart.
Add to Wishlist
Download
AI Customize
Market research plan slide with a triangular diagram, financial icons, and percentage based data visualization with captions.
Add to Wishlist
Download
AI Customize
Best Market Research PPT and Google Slides Template
Add to Wishlist
Download
AI Customize
Circular diagram of the R&D process featuring eight steps: Market Research, Product Development, Innovation Management, and Prototype Testing.
Add to Wishlist
Download
AI Customize
Research and development slide with a bar chart displaying data for kids, teens, and adults, with icons alongside.
Add to Wishlist
Download
AI Customize
Best Market Research Infographics Presentation Template
Add to Wishlist
Download
AI Customize
Market research slide featuring two side-by-side bar charts illustrating brand awareness metrics across multiple brands.
Add to Wishlist
Download
AI Customize
Illustration of three people conducting research with a magnifying glass and clipboard, and four texts with icons.
Add to Wishlist
Download
AI Customize
Infographic with diamond icons in green and blue, illustrating key market analysis processes and their descriptions.
Add to Wishlist
Download
AI Customize
Market research infographic PPT slide showing a 70-30 percent comparison with user icons and financial symbol with a caption.
Add to Wishlist
Download
AI Customize
Vertical bar graph with six multi-colored bars showing percentages from 30% to 100%, with icons representing categories.
Add to Wishlist
Download
AI Customize
Market research dashboard with a segmented horizontal bar chart analyzing brand perception and a donut chart.
Add to Wishlist
Download
AI Customize
Market research slides include topics like primary research, secondary research, and qualitative and quantitative approaches.
Add to Wishlist
Download
AI Customize
Captivating Market Potential Presentation Template
Free
Add to Wishlist
Download
AI Customize
Market research slide showing a line graph with three levels over the years 2016 and 2019, with a caption box.
Add to Wishlist
Download
AI Customize
Ready To Use Research Data Presentation Templates Design
Add to Wishlist
Download
AI Customize
Four-step diagram showing icons for market research elements, each with a percentage progress bar and placeholder text.
Add to Wishlist
Download
AI Customize
Effective Business Research Presentation Template