Free - Engaging Pyramid PPT Free Download for Data Visualization
Free

 Canva
Canva
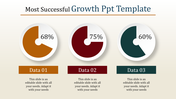
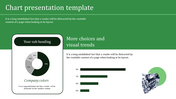
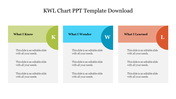

"Pyramid PowerPoint Template and Google Slides Themes"
"Pyramid PowerPoint Template and Google Slides Themes" offers a refreshing approach to presentations. Featuring three nodes with captions, title holders, and text areas, this template is designed for professionals, educators, and anyone seeking to impress. Clear and attention-grabbing, it seamlessly blends creativity with practicality, ensuring your ideas shine through every slide. Each step of the Pyramid is a step towards success, making it perfect for those ready to elevate their presentations. Download now for free and embark on a journey of impactful storytelling!
Features of the Template
- 100 % customizable slides.
- The slide show is in 4:3, 16:9, zip format.
- There is powerful connectivity with Google Slides and PowerPoint.
- It is simple and quick to alter the slide's color.
- An efficient template that can be easily accessed immediately.
- Well-crafted template with an instant download facility.


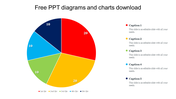
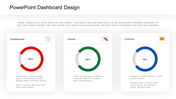
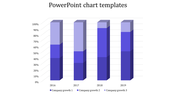
You May Also Like These PowerPoint Templates
Free
Add to Wishlist
Download
AI Customize

Add to Wishlist
Download
AI Customize

Free
Add to Wishlist
Download
AI Customize

Add to Wishlist
Download
AI Customize

Add to Wishlist
Download
AI Customize


Add to Wishlist
Download
AI Customize


Add to Wishlist
Download
AI Customize

Add to Wishlist
Download
AI Customize

Add to Wishlist
Download
AI Customize

Add to Wishlist
Download
AI Customize

Add to Wishlist
Download
AI Customize

Add to Wishlist
Download
AI Customize

Add to Wishlist
Download
AI Customize

Add to Wishlist
Download
AI Customize

Add to Wishlist
Download
AI Customize

Add to Wishlist
Download
AI Customize

Add to Wishlist
Download
AI Customize

