Try Our Project Dashboard PowerPoint Presentation Template

Project dashboard with pie, funnel, and bar charts displaying data for various categories and quarters.
P.ID : 6665
    757 views
    52 Downloads
    Get Custom Slides by Experts
    Instantly Access Templates in PowerPoint

    Project Dashboard Presentation Template


    Are you ready to revolutionize the way you present data? Our Dashboard PowerPoint presentation template is your gateway to creating compelling and insightful presentations.

    Slide Description:

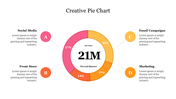
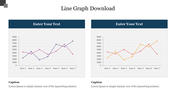
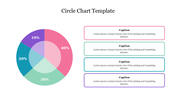
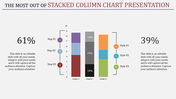
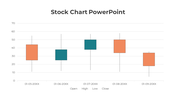
    Our template features a pie chart with segments labeled 1st Qtr, 2nd Qtr, 3rd Qtr, and 4th Qtr. A bar chart showing multiple bars across three series, each representing different categories. These charts allow for easy comparison and visualization of project performance. Below the charts, there’s a horizontal bar graph with five categories (labeled Category 1 to Category 5). Corresponding values (ranging from 1000 to 5000) are displayed next to each bar.


    Purpose of this slide:

    To provide an organized and concise way to present project data during meetings or presentations.


    Who can benefit?

    Project Managers: They can use this template to track KPIs, monitor progress, and communicate project status effectively. Team Members: It helps team members understand project trends and identify areas for improvement. Stakeholders: They can assess project health and make informed decisions based on the visualized data.


    Download now!


    Features of the template:


    •  Slides are available in 4:3 & 16:9
    • Well-crafted template with instant download.
    • Get slides that are 100% customizable and easy to download
    Advertisement

    You May Also Like These PowerPoint Templates

    Add to Wishlist
    Download
    AI Customize
    Creative Peaks And Troughs PPT Presentation Template
    Add to Wishlist
    Download
    AI Customize
    Amazing PowerPoint Line Chart Template Slide Design
    Add to Wishlist
    Download
    AI Customize
    Attractive Charts And Graphs PowerPoint And Google Slides
    Add to Wishlist
    Download
    AI Customize
    A line graph showing a plot structure with key points marked by colored dots, representing key stages.
    Add to Wishlist
    Download
    AI Customize
    SEO Marketing Plan Template - Green Theme presentation
    Add to Wishlist
    Download
    AI Customize
    A donut chart with multiple segments in different colors next to a table displaying statistics and percentage changes.
    Add to Wishlist
    Download
    AI Customize
    Best Pie Chart Infographics PowerPoint And Google Slides
    Free
    Add to Wishlist
    Download
    AI Customize
    KWL Chart PowerPoint Presentation and Google Slides Themes
    Add to Wishlist
    Download
    AI Customize
    Editable charts PowerPoint Presentation Template Designs
    Free
    Add to Wishlist
    Download
    AI Customize
    Growth Pie Chart Presentation	Slide Template
    Add to Wishlist
    Download
    AI Customize
    Editable Microsoft Pie Chart Templates For Presentation
    Add to Wishlist
    Download
    AI Customize
    The Nice Growth PPT Template Presentation For Your Goals
    Free
    Add to Wishlist
    Download
    AI Customize
    Innovative Comparison Chart PPT Templates and Google Slides
    Add to Wishlist
    Download
    AI Customize
    Colorful Bar Chart Infographic PowerPoint Presentation
    Add to Wishlist
    Download
    AI Customize
    Business Growth Strategy Template-Pie Chart Model
    Add to Wishlist
    Download
    AI Customize
    Bar Graph PPT Template and Google Slides Presentation
    Add to Wishlist
    Download
    AI Customize
    Effective Pie Chart Template Presentation-Four Node
    Free
    Add to Wishlist
    Download
    AI Customize
    Unique KWL Chart PPT Presentation Template and Google Slides
    Free
    Add to Wishlist
    Download
    AI Customize
     circled pie chart presentation  with arrows