Project Dashboard PowerPoint Template And Google Slides


Project Dashboard Presentation Template
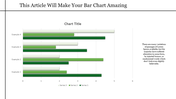
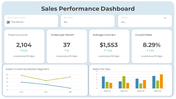
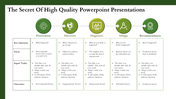
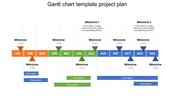
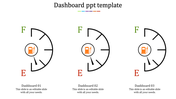
Get on top of your projects and see success unfold with our Project Dashboard PowerPoint Template. This awesome template helps you keep tabs on progress, spot any obstacles, and keep your team in the loop, so your chart stays on target and hits the mark. The main slide features a straightforward line graph that shows how your project is moving along over time. The horizontal line shows dates, giving you a dashboard of your project's journey, while the bottom shows percentages, so you can see how much you've achieved.
Whether you're a project manager, team leader, or student, this template is super flexible and works for projects big or small. It's easy to customize to fit your needs, so your projects stay organized, and everyone's on board. Download the Template now in PowerPoint and see the power of clear communication and visual tracking in action!
Features of the template:
- Slides are available in different nodes & colors.
- Easy to change the slide colors.
- Well-crafted template with instant download.


You May Also Like These PowerPoint Templates
Add to Wishlist
Download
AI Customize

Add to Wishlist
Download
AI Customize

Add to Wishlist
Download
AI Customize

Add to Wishlist
Download
AI Customize


Add to Wishlist
Download
AI Customize

Add to Wishlist
Download
AI Customize

Add to Wishlist
Download
AI Customize

Add to Wishlist
Download
AI Customize

Free
Add to Wishlist
Download
AI Customize


Add to Wishlist
Download
AI Customize

Add to Wishlist
Download
AI Customize

Add to Wishlist
Download
AI Customize

Add to Wishlist
Download
AI Customize

Add to Wishlist
Download
AI Customize

Add to Wishlist
Download
AI Customize

Add to Wishlist
Download
AI Customize

Add to Wishlist
Download
AI Customize

Add to Wishlist
Download
AI Customize
