Innovative Product PPT Template for Showcasing Products


Product PowerPoint Template and Google Slides
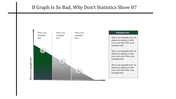
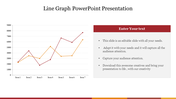
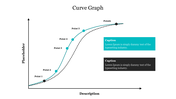
The "Product PowerPoint Template and Google Slides" features a dynamic bar graph presentation, showcasing product performance over the years. The graph includes percentage values and spans from 2015 to 2019, allowing users to visualize trends and growth trajectories effectively. Each product, labeled Product A, Product B, and Product C, is represented by a distinct color: red, green, and yellow, respectively.
This template is ideal for presenting product sales data, market share analysis, or performance comparisons in a visually engaging manner. Professionals in sales, marketing, product management, or business development can utilize this template to deliver impactful presentations.
Compatibility with PowerPoint and Google Slides. Available in 16:9 and 4:3 aspect ratios, catering to different screen sizes and presentation preferences. Provided in ZIP format for easy sharing and distribution. 100% customizable features. Download now.


You May Also Like These PowerPoint Templates
Add to Wishlist
Download
AI Customize

Add to Wishlist
Download
AI Customize

Add to Wishlist
Download
AI Customize

Add to Wishlist
Download
AI Customize

Add to Wishlist
Download
AI Customize

Add to Wishlist
Download
AI Customize

Add to Wishlist
Download
AI Customize

Add to Wishlist
Download
AI Customize

Add to Wishlist
Download
AI Customize

Add to Wishlist
Download
AI Customize

Add to Wishlist
Download
AI Customize

Add to Wishlist
Download
AI Customize

Add to Wishlist
Download
AI Customize

Add to Wishlist
Download
AI Customize

Add to Wishlist
Download
AI Customize

Add to Wishlist
Download
AI Customize

Add to Wishlist
Download
AI Customize

Add to Wishlist
Download
AI Customize

Add to Wishlist
Download
AI Customize

Add to Wishlist
Download
AI Customize
