Gray Color Product Comparison PowerPoint And Google Slides

Gray themed comparison chart with two columns outlining features of two phones, separated by a central weighing scale icon.
P.ID : 22549
    264 views
    25 Downloads
    Get Custom Slides by Experts
    Instantly Access Templates in PowerPoint

    Creative Agenda PowerPoint Template


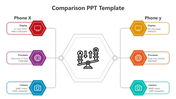
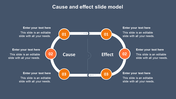
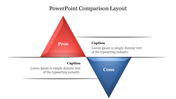
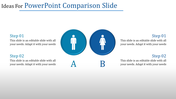
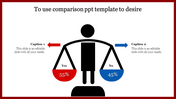
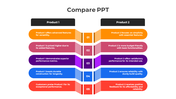
    Product comparison involves evaluating and contrasting various products to assist consumers in making informed purchasing decisions. Whether comparing smartphones, appliances, or services, this process emphasizes each item's features, benefits, and drawbacks, aiding individuals in selecting the most suitable option for their needs. Considering factors such as price, performance, durability, and customer reviews enables consumers to pinpoint products that align with their preferences. Product comparison templates offer a structured framework for organizing this information, facilitating clear and concise comparisons. This versatile template caters to consumers conducting research, marketers, sales professionals, and educators teaching decision-making skills. Its visually appealing and well-organized format assists in effectively comparing product features. All slides are fully editable, allowing seamless customization to fit specific comparisons. This template offers six options and features a cohesive gray color theme throughout. For presenters, it simplifies creating comprehensive comparisons, enhances communication, and facilitates consumer education. Download now to streamline product research and make informed decisions effortlessly.

    Features of this template


    • 100% customizable slides and easy to download.
    • The slide contains 16:9 and 4:3 formats.
    • Easy to change the colors of the slide quickly.
    • Highly compatible with PowerPoint and Google Slides.
    Advertisement

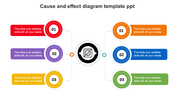
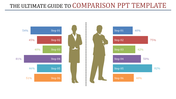
    You May Also Like These PowerPoint Templates

    Add to Wishlist
    Download
    AI Customize
    A comparison template with four numbered sections  arranged vertically in the center, with colored placeholder text boxes.
    Add to Wishlist
    Download
    AI Customize
    Scales comparison infographic showing a person holding balanced options with labels and percentages.
    Free
    Add to Wishlist
    Download
    AI Customize
    Slide with a circular pros and cons diagram, featuring green, yellow, and red sections with directional arrows.
    Add to Wishlist
    Download
    AI Customize
    Colorful venn diagram slides comparing data and information showing differences between data and info in different layouts.
    Add to Wishlist
    Download
    AI Customize
    Cause and effect diagram with two large arrows in red and blue, each linked to icons in colored boxes.
    Add to Wishlist
    Download
    AI Customize
    Comparison chart PPT template with side by side horizontal bar charts showing percentages, each paired with an icon.
    Free
    Add to Wishlist
    Download
    AI Customize
    Comparison slide for PowerPoint showing progress percentages for four steps with icons of a man and a woman.
    Free
    Add to Wishlist
    Download
    AI Customize
    Cause and effect slide with purple circular sections, icons, and connecting arrows, divided into three steps.
    Add to Wishlist
    Download
    AI Customize
    Comparison chart design featuring three hexagonal shapes labeled Project Name 01, 02, and 03, with colorful outlines.
    Add to Wishlist
    Download
    AI Customize
    Comparison infographic with two sections divided by a vertical line, each with colored caption areas for analysis.
    Free
    Add to Wishlist
    Download
    AI Customize
    Green themed cause and effect PPT slide diagram with a circular center and six connected placeholder text boxes.
    Free
    Add to Wishlist
    Download
    AI Customize
    A slide comparing two results with hourglass icons, showing a percentage breakdown with a man presenting the comparison.
    Add to Wishlist
    Download
    AI Customize
    Slide with four gray text box with colored edges, pointing inward from both sides toward the numbered center.
    Free
    Add to Wishlist
    Download
    AI Customize
    A business cause and effect diagram template, featuring hexagonal cause blocks with a central effect block.
    Add to Wishlist
    Download
    AI Customize
    Two column comparison slide with AI advantages on the left and disadvantages on the right, each listing four key points.
    Add to Wishlist
    Download
    AI Customize
    Product comparison table slide with a green section highlighting advantages and a red section showing disadvantages.
    Free
    Add to Wishlist
    Download
    AI Customize
    Three blue circular elements with numbers and text areas connected to a central document icon in a cause and effect layout.