Free - Preventive Maintenance PPT for Maintenance and Upgrade

Free
Preventive maintenance illustration featuring yellow peaks with icons and labels for different stages.
P.ID : 36400
    74 views
    24 Downloads
    Get Custom Slides by Experts
    Instantly Access Templates in PowerPoint

    Subtle Preventive Maintenance PPT


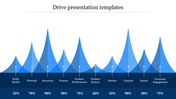
    Deliver your target audience based on efficiency within your organization, by using our Preventive Maintenance PPT And Google Slides. Suitable for facilities managers, maintenance supervisors and operations professionals. The slide has four peaks arranged sequentially. Each of them comes along with icons representing maintenance, upgrades, long-term planning and system efficiency. Captions accompany each peak, to elaborate preventive maintenance strategies and their benefits. 

    Ideal for use in industrial seminars, facility management workshops and corporate training sessions. Helpful to illustrate the importance of proactive maintenance practices in minimizing downtime, optimizing equipment lifespan and enhancing operational efficiency. Download to engage among the audience.

    Features of the template

    • The slide contains 16:9 and 4:3 formats.
    • Compatible with Google slide themes and PowerPoint.
    • 100% customizable slides and free to download.
    • It is easy to change the colors of the slide quickly.
    • Well-crafted template with an instant download facility.
    Advertisement

    You May Also Like These PowerPoint Templates

    Add to Wishlist
    Download
    AI Customize
    Data driven marketing slide illustrating a circular process with four steps harvest, analyze, activate, and optimize.
    Add to Wishlist
    Download
    AI Customize
    A colorful bar graph showing data driven insights with categories along with their corresponding percentages.
    Add to Wishlist
    Download
    AI Customize
    Data driven slides featuring various data visualizations, including charts and graphs with different colored layout designs.
    Add to Wishlist
    Download
    AI Customize
    Data driven slide featuring a colorful chart with percentage values, showing a timeline from 4m to 6m with placeholder text.
    Add to Wishlist
    Download
    AI Customize
    Data driven slide displaying five key areas on a colorful circle with icons and text description.
    Free
    Add to Wishlist
    Download
    AI Customize
    Preventive maintenance illustration featuring yellow peaks with icons and labels for different stages.
    Add to Wishlist
    Download
    AI Customize
    Four step process for data driven marketing with color coded text boxes and description.
    Free
    Add to Wishlist
    Download
    AI Customize
    Bar chart with overlapping orange and peach shades depicting percentages for various categories on a white background.
    Add to Wishlist
    Download
    AI Customize
    Diagram showing percentages for date driven financing, marketing, teamwork, and scheduling, with icons and a radar chart.
    Free
    Add to Wishlist
    Download
    AI Customize
    Drive presentation slide showing layered area chart with metrics from profit model to customer engagement on a purple theme.
    Free
    Add to Wishlist
    Download
    AI Customize
    Red gradient mountain peak shapes on a white layout, showing varied heights for percentage data analysis.
    Free
    Add to Wishlist
    Download
    AI Customize
    Drive business presentation slide with a yellow line graph displaying varying percentages for ten key business categories.
    Free
    Add to Wishlist
    Download
    AI Customize
    Drive presentation template with orange gradient bell curves representing data percentages, on a red footer section.
    Add to Wishlist
    Download
    AI Customize
    Data driven PowerPoint slide featuring a line graph with three data sets and colorful circular progress indicators below.
    Add to Wishlist
    Download
    AI Customize
    The Future Of Data Catalogs PPT and Google Slides Themes
    Add to Wishlist
    Download
    AI Customize
    A data driven slide featuring a bar graph with categories A, B, C, D, and E, displaying percentages across various scores.
    Add to Wishlist
    Download
    AI Customize
    Editable Data Driven Presentation Template With Charts