Our Predesigned Presentation PowerPoint Chart PPT Slides

PPT chart with five colorful percentage indicators displayed in curved circular segments, ranging from 30 to 70 percent.
P.ID : 47577
    788 views
    137 Downloads
    Get Custom Slides by Experts
    Instantly Access Templates in PowerPoint

    Creative Charts PPT Slide

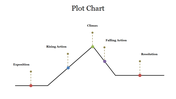
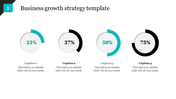
    Charting best describes how the economy is progressing. If you are up to date with the latest trends and chart analysis, this chart template will be a perfect guide for you. Here is the spot-on slide to analyze the growth, progress, and more. Coming with real-life examples that can be used for your PPTs, this slide breaks ground with an elegant look for data presentation. With some practice, you can become a pro at creating circular charts with this template! Those five nodes in the circular chart can never be missed out, right? So, Get the benefit of this lucky draw.

    Features of the template

    • 100% customizable slides and easy to download.
    • Slides are available in different nodes & colors.
    • The slide contained 16:9 and 4:3 formats.
    • Easy to change the slide colors quickly.
    • Well-crafted template with an instant download option.
    • Five nodes with ample text area.
    Advertisement

    You May Also Like These PowerPoint Templates

    Free
    Add to Wishlist
    Download
    AI Customize
    Unique KWL Chart PPT Presentation Template and Google Slides
    Free
    Add to Wishlist
    Download
    AI Customize
     circled pie chart presentation  with arrows
    Free
    Add to Wishlist
    Download
    AI Customize
    Innovative Multiple Chart PowerPoint And Google Slides
    Free
    Add to Wishlist
    Download
    AI Customize
    High Quality PowerPoint Templates and Google Slides
    Add to Wishlist
    Download
    AI Customize
    Project management dashboard slide showing colored charts for net worth, sector allocation, and various financial metrics.
    Add to Wishlist
    Download
    AI Customize
     Sales And Marketing Strategy Template	in Chart Model
    Add to Wishlist
    Download
    AI Customize
    Circular chart with seven pastel colored segments, each with  icons and captions around it.
    Add to Wishlist
    Download
    AI Customize
    Successive Growth Chart Template PowerPoint Presentation
    Add to Wishlist
    Download
    AI Customize
    Project management dashboard slide with visually colored charts and graphs displaying task status with icons.
    Add to Wishlist
    Download
    AI Customize
    Creative KPI Scorecard PowerPoint Template Slide PPT
    Add to Wishlist
    Download
    AI Customize
    Dashboard PowerPoint Template and Google Slides
    Add to Wishlist
    Download
    AI Customize
    Row of four colored speedometer-style gauges, each showing varying percentages with needle, and captions at the bottom.
    Free
    Add to Wishlist
    Download
    AI Customize
    Blue Theme KPI Presentation Template PPT Slide
    Add to Wishlist
    Download
    AI Customize
    Digital Dashboard Designed KPI PowerPoint Template
    Add to Wishlist
    Download
    AI Customize
    Six semicircular gauges with colored indicators in red, purple, blue, yellow, pink, and green on a white backdrop.
    Free
    Add to Wishlist
    Download
    AI Customize
    Slide showcasing three different types of colored charts an area chart, a bar chart, and a line chart, with captions below.
    Add to Wishlist
    Download
    AI Customize
    Three pie charts with segmented sections and percentage labels, each chart featuring placeholder text below.