Incredible PPT Chart Templates Presentation Slide Design

Incredible PPT Chart Templates Presentation Slide Design
P.ID : 38480
    103 views
    13 Downloads
    Get Custom Slides by Experts
    Instantly Access Templates in PowerPoint

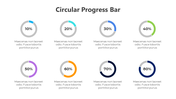
    Glowing PPT Chart Template

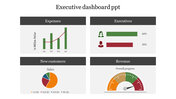
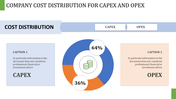
    Individuals can greatly benefit from our outstanding PPT chart templates for creating visually engaging presentations. It has percentage values in four circles. In the middle of each circle, which is filled with a different color, is a percentage figure. Data like market share, sales performance, or any other numerical metric can be perfectly presented using this template. The template is also completely customizable, allowing you to adjust the colors, sizes, and percentage values to meet your unique requirements. When making your presentation, you may save time and effort by using this template, and you can be sure that your audience will be impressed.

    Features of the template

    • 100% customizable slides and easy to download.
    • Slides are available in different colors
    • The slide has 4:3 and 16:9 formats.
    • Easy to change the slide colors quickly.
    • Appealing Presentation to impress an audience.
    • Create feature-rich slide presentations. 
    • An eye-pleasing color slide helps to give a catchy display.
    • It is proficient with PPT and Google Slides.
    Advertisement

    You May Also Like These PowerPoint Templates

    Add to Wishlist
    Download
    AI Customize
    Infographic with four bar graphs, each showing data points A to D, and captions areas in green boxes.
    Add to Wishlist
    Download
    AI Customize
    Dashboard with a bar chart and pie chart in purple shades, comparing project status across regional shares.
    Add to Wishlist
    Download
    AI Customize
    Chart infographics with a variety of chart including pie chart, bar charts, line graphs, and area charts with a caption area.
    Add to Wishlist
    Download
    AI Customize
    Business slide with three pie charts in teal, green, and red showing percentages and captions below.
    Add to Wishlist
    Download
    AI Customize
    Horizontal progress bars in red and blue, labeled with percentages, along with four labeled stages below.
    Add to Wishlist
    Download
    AI Customize
    Illustration of people analyzing charts on large screens, with text on the right side.
    Add to Wishlist
    Download
    AI Customize
    A colorful statistics slide featuring various charts including a world map, bar graphs, and a pie chart with text area.
    Add to Wishlist
    Download
    AI Customize
    Statistics slide with bar charts, line graphs, and progress indicators showing mobile users and social media budgets.
    Add to Wishlist
    Download
    AI Customize
    Diffusion model curve divided into five colored sections in yellow, pink, teal, blue, and orange, with percentages.
    Add to Wishlist
    Download
    AI Customize
    Statistics slide showing four bar charts with monthly data for April to July, including numerical values and icons.
    Add to Wishlist
    Download
    AI Customize
    Astounding Inferential Statistics PPT And Google Slides
    Free
    Add to Wishlist
    Download
    AI Customize
    Colorful statistics slide featuring various charts and graphs, including bar graphs, pie charts, and gender icons.
    Add to Wishlist
    Download
    AI Customize
    Statistics template featuring a bar chart and line graph, with placeholder text areas for detailed data descriptions.
    Free
    Add to Wishlist
    Download
    AI Customize
    Data statistics template featuring bar graphs, percentages, and text sections for detailed analysis with caption areas.
    Add to Wishlist
    Download
    AI Customize
    A data statistics PowerPoint template displaying a chart with monthly trends and comparisons between regions.