Make Use Of Our PPT Chart Templates Design Presentation

Chart PPT template with four circular charts showing data in thousands, with placeholder text for each chart.
P.ID : 38443
    151 views
    17 Downloads
    Get Custom Slides by Experts
    Instantly Access Templates in PowerPoint

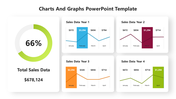
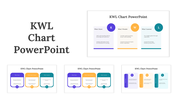
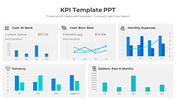
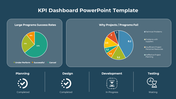
    Presentation Slide on Charts

    Our chart templates guarantee a simplified representation of significant data and connections among various data elements. With the aid of a chart template, you can precisely display illustrative data, even in cases where there isn't enough space to represent a lot of information. Chart templates prove beneficial in demonstrating organizational structures, worker tasks, and relationships among employees, ultimately increasing employee cooperation and performance.

    Features of the template

    • 100% customizable slides and easy to download.
    • Slides are available in different nodes and colours.
    •  The slides contain 16:9 and 4:3 formats.
    •  Easy to change the colours quickly.
    • It is a well-crafted template with an instant download facility.
    • This slide is compatible with Google Slide Themes.
    •  Available in vast options.
    •  Simple to use.
    Advertisement

    You May Also Like These PowerPoint Templates

    Free
    Add to Wishlist
    Download
    AI Customize
    Six charts in different formats, including line, pie, bar, and gauge, all in blue and gray, displaying data trends.
    Free
    Add to Wishlist
    Download
    AI Customize
    Presentation slide layout illustrating key elements for high quality PowerPoint including steps with icons.
    Add to Wishlist
    Download
    AI Customize
    Color coded Gantt chart slide outlining a yearly project timeline with quarterly milestones and description boxes.
    Add to Wishlist
    Download
    AI Customize
    Circular chart with seven pastel colored segments, each with  icons and captions around it.
    Add to Wishlist
    Download
    AI Customize
    Gantt chart slide showing a project timeline with tasks categorized into colorful sections, represented by horizontal bars.
    Add to Wishlist
    Download
    AI Customize
    Pie chart slide showing budget distribution for facebook, google, and linkedIn ads with respective percentages.
    Add to Wishlist
    Download
    AI Customize
    Project management dashboard slide with visually colored charts and graphs displaying task status with icons.
    Add to Wishlist
    Download
    AI Customize
    Visual KPI layout with performance bar chart, doughnut chart, and percentage indicators for project analysis.
    Add to Wishlist
    Download
    AI Customize
    Dashboard PowerPoint Template and Google Slides
    Add to Wishlist
    Download
    AI Customize
    Row of four colored speedometer-style gauges, each showing varying percentages with needle, and captions at the bottom.
    Add to Wishlist
    Download
    AI Customize
    Three pie charts in brown, blue, and green sections, each with labeled percentages and caption lines.
    Free
    Add to Wishlist
    Download
    AI Customize
    Multicolored circular pie chart in yellow, red, and green, with labeled categories listed on the right.
    Add to Wishlist
    Download
    AI Customize
    Four donut charts in red, blue, green, and yellow, displaying percentages with corresponding content boxes below.
    Add to Wishlist
    Download
    AI Customize
    A chart with three vertical bars in red, purple, and orange, with icons and descriptive text on the left.
    Free
    Add to Wishlist
    Download
    AI Customize
    Bar chart with five vertical bars representing data analysis with various high, low, and volume indicators displayed.
    Add to Wishlist
    Download
    AI Customize
    A monthly PowerPoint template displaying colorful wave like graphs for each month from January to June with placeholder text.
    Add to Wishlist
    Download
    AI Customize
    Three pie charts with segmented sections and percentage labels, each chart featuring placeholder text below.