Free - Easy To Editable Chart PowerPoint Presentation Templates
Free


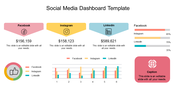
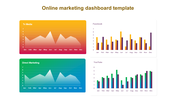

Practical Chart PPT Templates with Different Color Themes
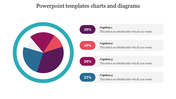
We are presenting our chart PPT template, an invaluable asset for your data visualization needs. This free, user-friendly template offers a myriad of layouts and styles, ensuring a seamless fit for your diverse presentation requirements.
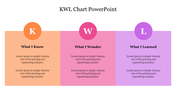
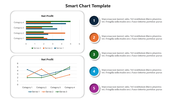
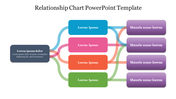
The template boasts a well-organized structure, featuring a prominent title section followed by a grid of placeholders thoughtfully designed for charts and graphs. The versatility extends to a convenient text box at the slide's bottom, providing an opportunity to enhance your content with additional information or context.
Ideal for professionals, educators, and anyone keen on delivering impactful presentations, this Chart PowerPoint Template simplifies the creation of visually compelling slides. Elevate your data-driven storytelling, captivate your audience, and make your message resonate with clarity.
Ready to transform your charts into compelling narratives? Download our Chart PowerPoint Template now and embark on a journey of seamless and impactful presentations.
Features of the template
- 100% customizable slides are easy to download.
- Slides are available in different colors.
- The slide has 4:3 and 16:9 formats.
- It is easy to change the slide colors quickly.
- It has a cute design to impress an audience.
- Create feature-rich, animated presentations.


You May Also Like These PowerPoint Templates
Add to Wishlist
Download
AI Customize

Add to Wishlist
Download
AI Customize

Add to Wishlist
Download
AI Customize

Add to Wishlist
Download
AI Customize


Add to Wishlist
Download
AI Customize


Add to Wishlist
Download
AI Customize

Add to Wishlist
Download
AI Customize

Add to Wishlist
Download
AI Customize

Add to Wishlist
Download
AI Customize

Add to Wishlist
Download
AI Customize

Add to Wishlist
Download
AI Customize

Add to Wishlist
Download
AI Customize


Add to Wishlist
Download
AI Customize

Add to Wishlist
Download
AI Customize

Add to Wishlist
Download
AI Customize

Add to Wishlist
Download
AI Customize

Add to Wishlist
Download
AI Customize
