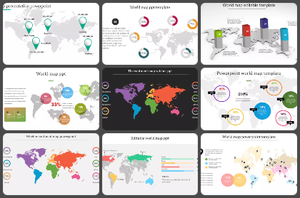
Geographic Infographics PowerPoint Templates are pre-made PowerPoint presentations that feature a variety of geographical visual elements such as maps, charts, graphs, and illustrations. You can use them to present data, facts, and statistics related to geography.
You can use these Geographic Infographics Slides to present geographical data in presentations, display information about the world and its people, map out routes and journeys, and illustrate stories and concepts related to geography.
Choose an appropriate template. Use a pre-made template or create your own. Once you have chosen a template, you can add visuals to your slides. Visuals such as maps, graphs, charts, and images. Suppose you want to learn how to use the PowerPoint tool. Visit Tips and tricks for detailed instructions.
Anyone can use geographic Infographics PPT Templates, including teachers, students, business professionals, researchers, and marketers, to present geographical data in a professional and organized manner.
Geographic infographics PowerPoint slides provide a visual way to communicate complex data and information about geographic locations. You can use them to help explain the geography of a region and show population density and demographics.
Many websites offer free Geographic Infographics PPT templates. Slide egg is one of the best PowerPoint providers. Our websites' uniquely designed templates help you to explain the effects of climate change, illustrate the impact of human activities, and show the diversity of a region's landscape.