800+ Free Financials PowerPoint Templates
Whether you're presenting a quarterly budget to the board, pitching an investment strategy to stakeholders, or building an annual financial report from scratch, having the right slide structure makes the difference between a presentation that lands and one that loses the room.
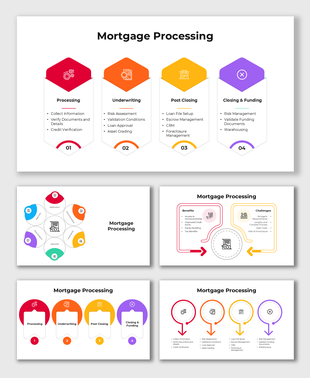
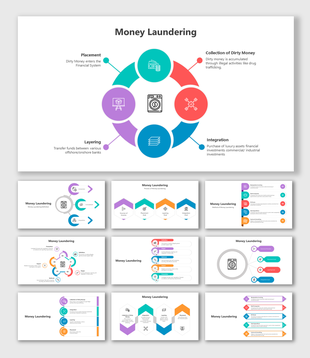
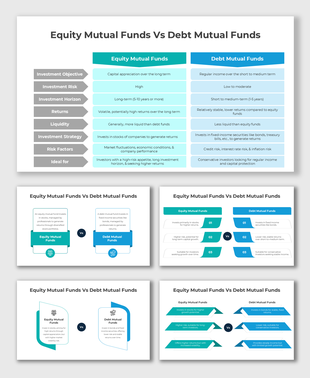
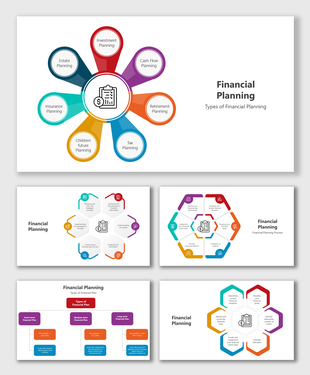
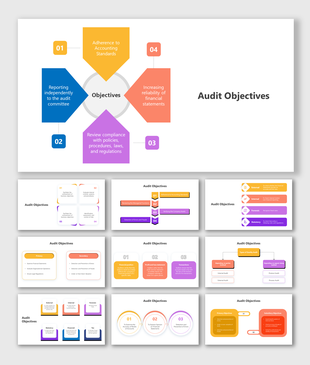
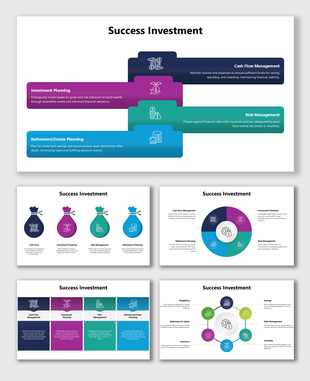
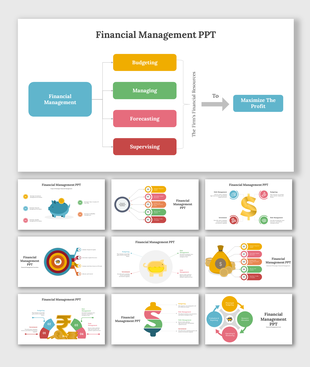
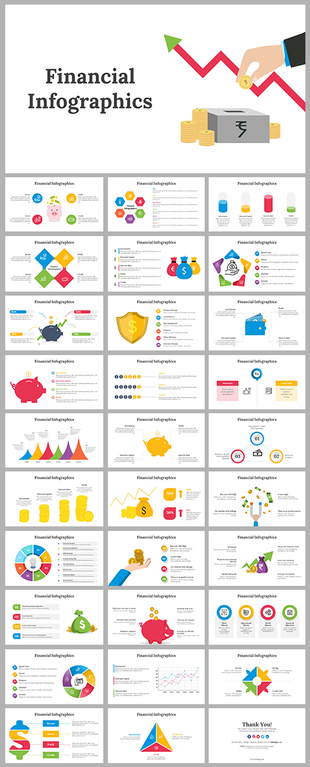
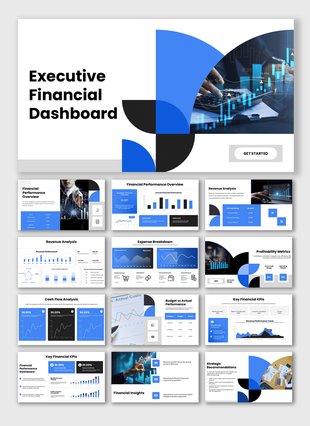
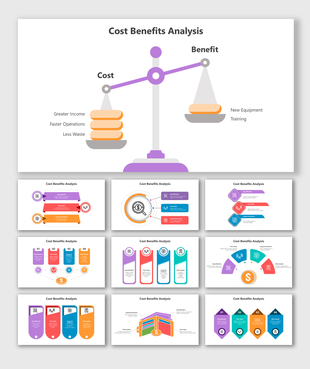
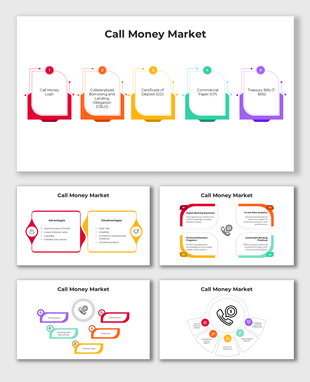
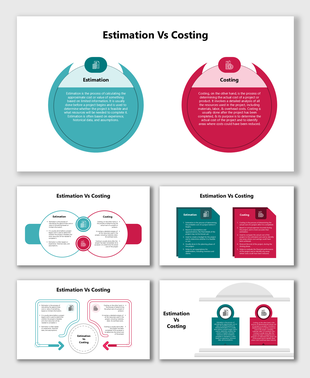
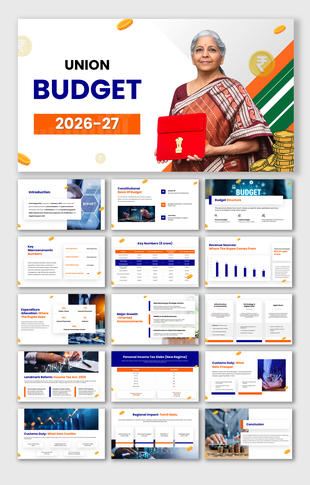
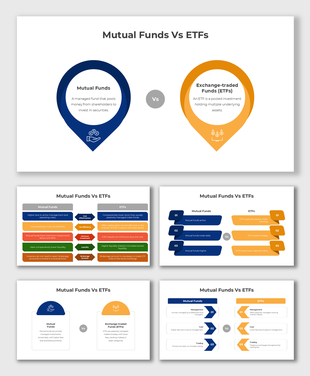
Showing48 of866


Choose a Financial Presentation Template by the Decision You Need to Make
The right financial presentation template depends on the question your audience needs answered. Begin with the meeting’s purpose, the available data, and the expected decision before comparing colors or visual styles.
-
Review current financial performance
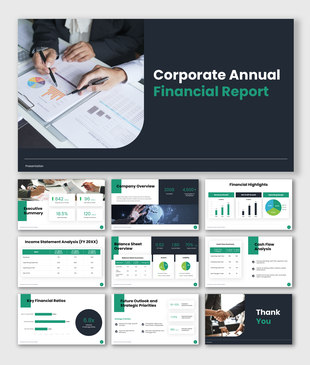
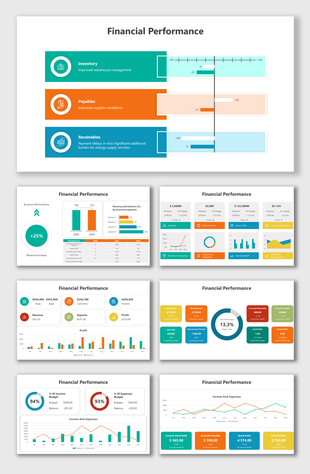
Look for slides that can summarize headline results, revenue, costs, margins, cash position and material variances. The presentation should allow you to compare actual performance with the budget, forecast, target or previous period. A Financial Performance presentation provides a useful reference when these results need to be communicated together.
-
Plan future financial performance
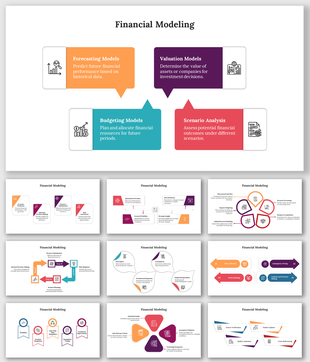
A planning deck should separate known results from assumptions and projections. Look for space to explain the forecast period, revenue and cost assumptions, cash requirements, alternative scenarios and the decisions management must make. Financial Modeling slides are relevant when assumptions and projected outcomes need to remain visibly connected.
-
Evaluate an investment or proposal
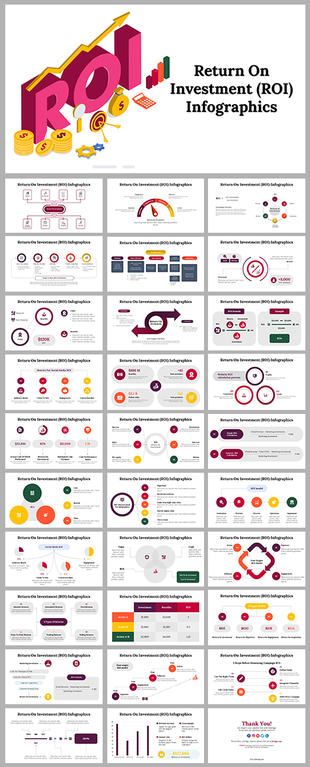
An investment presentation should show the business need, required investment, expected benefits, calculation method, payback period, major assumptions and risks. It should also make clear which figures are confirmed and which are estimates. Return on Investment Infographics can help organize the calculation and comparison without hiding the underlying assumptions.
-
Communicate financial risk or assurance
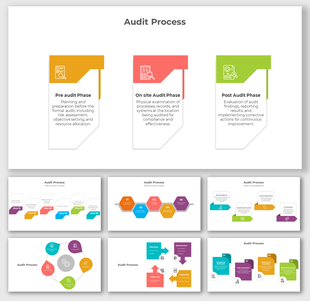
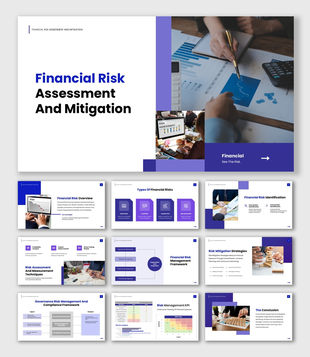
Choose a structure that can show the risk, likelihood, potential financial impact, existing controls, proposed mitigation, responsible owner and review date. For assurance work, include the audit scope, evidence, findings and follow-up actions. A Financial Risk Assessment and Mitigation template is a relevant starting point when risks and controls must be reviewed together.
-
Explain a financial service or payment process
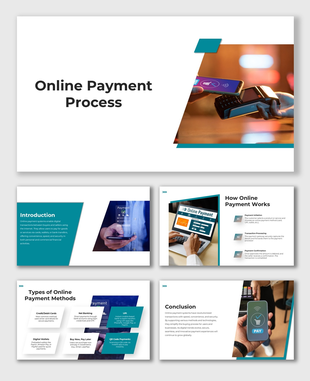
A process presentation should identify the participants, transaction stages, approvals, information transferred, controls, exceptions and final outcome. Online Payment Process slides can help map this sequence when the audience needs to understand how a transaction moves from initiation to completion.
A template should reduce design work and improve information structure. It should not determine the conclusion, calculation or recommendation for you.
What Should a Clear Financial Presentation Show?
A useful financial presentation turns figures into an understandable conclusion, risk, recommendation or decision. Most financial decks should make the following points clear:
- 01Purpose: What question or decision does the presentation address?
- 02Reporting scope: Which company, department, project, market and period do the figures cover?
- 03Headline metrics: Which three to five numbers matter most to this audience?
- 04Performance drivers: What caused the result—not simply whether it increased or decreased?
- 05Comparison: How does actual performance compare with the budget, forecast, target or previous period?
- 06Outlook: Which assumptions influence the next forecast?
- 07Action: What decision, correction, investment or follow-up is required?
State the currency, units, reporting period and data source wherever ambiguity is possible. Clearly distinguish actual results from budgets, estimates and forecasts.
A Practical Financial Analysis Presentation Structure
If you are unsure how to arrange the information, the following sequence works for many management, board, client and investor discussions.
1. Purpose and Reporting Period
Name the subject, reporting period, intended audience and decision required. This gives every later figure the correct context.
2. Executive Summary
Present the most important result, its supported cause and the action being recommended. Complete this slide after the analysis so it reflects the evidence presented in the rest of the deck.
3. Financial KPI Snapshot
Show only the metrics needed to understand the remaining slides. Label the definitions when different teams may calculate a metric differently. The KPI presentation templates can help when several financial indicators must be organized into a scorecard or dashboard.
4. Revenue, Cost and Margin Movement
Compare current results with an appropriate baseline and explain material variances. When revenue performance must be connected with targets, regions, products or pipeline outcomes, the Sales Report presentation templates provide supporting reporting structures.
5. Cash or Financial Position
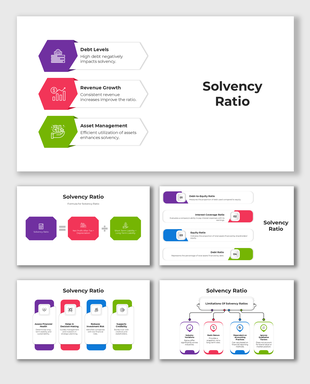
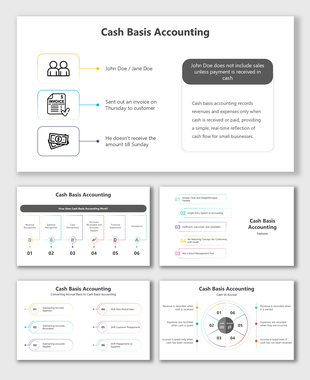
Show liquidity, cash flow, funding, assets, liabilities, solvency or another measure relevant to the meeting. Do not treat profit and cash flow as interchangeable. If the discussion requires statement layouts or accounting processes, refer to the Accounting presentation templates.
6. Forecast and Assumptions
Explain what may happen next and identify the assumptions that could change the projection. Where appropriate, show base, upside and downside scenarios instead of presenting one forecast as certain.
7. Risks, Decisions and Next Steps
Finish with the risks that remain, the decision required, the actions to be taken, responsible owners and realistic deadlines.
Supporting calculations and detailed tables can sit in an appendix. This keeps the main discussion focused while allowing the audience to inspect the evidence when necessary.
Match the Visual to the Financial Question
Choose a visual because it makes a financial relationship easier to understand—not simply because space is available on the slide.
- ·Use a line chart to show movement across months, quarters or years.
- ·Use clustered columns or bars to compare actual results with a target, budget or previous period.
- ·Use a waterfall or bridge chart to explain how individual changes produced the final result.
- ·Use a stacked bar chart to show how a total is divided across products, departments, regions or cost groups.
- ·Use a sorted horizontal bar chart to compare several categories or rank performance.
- ·Use a dashboard when decision-makers need several related KPIs in one view.
- ·Use a small table when exact values matter more than the overall pattern. The Table presentation templates can help organize structured comparisons, but unnecessary rows and columns should still be removed.
Do not turn every figure into a chart. A chart should reveal a trend, variance, comparison, composition or relationship that would take longer to understand in a spreadsheet.
How to Use the Filters on This Page
The filters above the template gallery can reduce the time spent searching:
- Choose Single Slides when you need one chart, process, comparison or dashboard to add to an existing presentation.
- Choose Decks when you need several coordinated slides for a complete financial story.
- Use the Free filter when you only want products currently marked as free. Not every template in the collection is free.
- Use Relevant to begin with the closest topical matches.
- Use Mostly Downloaded when you want to review designs frequently selected by other users.
Preview the complete slide set before choosing a template. A suitable cover does not guarantee that the remaining slides support your financial story.
After selecting a template:
- 01Remove slides that do not contribute to the conclusion.
- 02Replace every sample number, label and statement.
- 03Apply consistent currency, unit, date and percentage formats.
- 04Add source or calculation notes where required.
- 05Confirm the available editing and download formats on the product page.
The Edit option on a template card can be used to begin changing its content directly on the site.
Create a Financial Presentation with AI
Use the AI builder above when no single template matches the complete presentation you need. A useful financial prompt should specify:
- ·The intended audience
- ·The meeting purpose
- ·The reporting period
- ·The required slide sequence
- ·The financial metrics or calculations
- ·The comparisons to include
- ·The decision expected from the audience
- ·What the AI must not invent
Financial prompts should explicitly instruct the AI to use labelled placeholders when real data has not been supplied. Otherwise, a generated draft may add plausible-sounding figures, explanations, forecasts or recommendations that are not based on your records.
The following prompts were tested in the AI builder above and produced structured previews using placeholders instead of unsupported financial figures.
Copy-Paste Prompt: Budget-versus-Actual Review
Build a 10-slide budget-versus-actual review for an Operations department covering Q2 2026. Use clearly labelled placeholders only; do not invent figures, variance causes, performance conclusions, forecasts, owners or deadlines. Include: purpose, KPI summary, revenue actual versus budget, operating expenses actual versus budget, profit, cash flow, material variances, revised full-year forecast with assumptions, corrective actions with owner and due-date placeholders, and the decision required. Use readable charts and tables. Do not add polls, quizzes, word clouds or audience questions.
Before generating the presentation, replace the department, reporting period and required decision with details relevant to your meeting.
Copy-Paste Prompt: Investment and ROI Proposal
Build a 10-slide investment and ROI proposal for a new business technology initiative. The audience is an executive finance committee. Use labelled placeholders only; do not invent costs, benefits, ROI, payback periods, assumptions, recommendations or risk ratings. Include: decision requested, business need, proposed investment, cost categories, benefit categories, ROI calculation framework, payback and breakeven framework, base/upside/downside scenarios, major risks with mitigations, and approval plus next steps. Clearly distinguish inputs, calculations and management assumptions. Do not add polls, quizzes, word clouds or audience questions.
Replace the project, audience and decision before generating the presentation. Enter the real financial data only after verifying that you are permitted to use it in the tool.
Check an AI-Generated Financial Presentation Before Using It
AI-generated slides are a starting structure, not verified financial analysis. Review the draft specifically for problems that automated generation may introduce:
- ✓Replace every placeholder and sample statement.
- ✓Remove figures that were not supplied by you or taken from an approved source.
- ✓Recalculate totals, percentages, ratios and formulas outside the generated slide.
- ✓Remove explanations of financial performance that are not supported by evidence.
- ✓Clearly label assumptions, estimates, scenarios and forecasts.
- ✓Do not accept an investment, accounting, tax, legal or regulatory recommendation without qualified review.
- ✓Confirm that charts accurately represent the figures entered into them.
- ✓Do not enter confidential company, employee, customer or investor information unless you are authorized to process it using the AI tool.
The person preparing the presentation remains responsible for the accuracy, confidentiality and suitability of its final content.
Add Interaction Only When the Meeting Requires It
Interaction should serve a specific meeting purpose. A routine financial report does not automatically need polls, quizzes or audience questions.
-
A Live Poll may help when authorized stakeholders must indicate a preference between budget scenarios, investment priorities or proposed actions. The result should guide discussion rather than replace the financial analysis or formal approval process.
-
Live Q&A can collect questions during a large presentation without repeatedly interrupting the speaker. Questions can then be addressed at an appropriate point in the meeting.
Avoid using audience-response tools to collect account information, personal data, unpublished results or other confidential financial information. If interaction does not improve the decision, leave it out.
Check the Numbers Before You Present
Before sharing the completed presentation, confirm that:
- ✓The reporting period and currency are visible.
- ✓Thousands, millions and percentages use consistent notation.
- ✓Actual, budgeted and forecast figures are clearly labelled.
- ✓Totals, percentages and chart values agree with the source data.
- ✓Important figures include an appropriate source and date.
- ✓Every forecast identifies its main assumptions.
- ✓Material variances include a supported explanation.
- ✓Confidential figures are shared only with the intended audience.
- ✓The final slide states the decision or action required.
A useful financial presentation should help the audience understand what changed, why it changed, what could happen next and what they need to do about it.
Explore Similar Collections
Become an expert with SlideEgg
Watch quick, practical walkthroughs and level up your presentation design skills in minutes.

Frequently Asked Questions
Are these financial presentation templates compatible with Google Slides?
Yes. All SlideEgg financial presentation templates download as .pptx files, which open directly in Google Slides. Upload to Google Drive, open with Google Slides, and all charts, graphs, and data slides are fully editable — no conversion or design software needed.
Can I edit the charts and graphs in these financial templates?
Yes. All charts are native PowerPoint objects — bar charts, pie charts, waterfall charts, and financial dashboards are all built with PowerPoint's chart editor. Click the chart, update the data table, and your numbers update automatically. No design software or plugins needed.
What types of financial presentations are included in this collection?
The collection covers 800+ templates across budget presentations, investment pitch decks, ROI analysis reports, financial dashboard templates, tax and accounting slides, annual report decks, revenue and P&L templates, financial forecasting slides, FinTech company profiles, and startup funding presentations.
Are SlideEgg's financial templates free to download?
Yes. All financial presentation templates on SlideEgg are free to download in .pptx format. No account creation, no watermark, and no sign-up required — click download and the file is yours immediately.
Which financial template should I use for an investor pitch?
For investor pitches, use templates from the Investment Pitch Deck or Investment Highlights sections. These include slides for market opportunity, financial projections, funding ask, deal structure, and return on investment — structured to present to angel investors, VCs, or private equity firms.
Can I use these templates for a professional financial report or audit presentation?
Yes. The collection includes templates for audit summaries, financial performance reports, compliance presentations, tax planning decks, and profit and loss reports — used by CFOs, finance managers, accountants, and consultants presenting to boards, clients, or regulators.