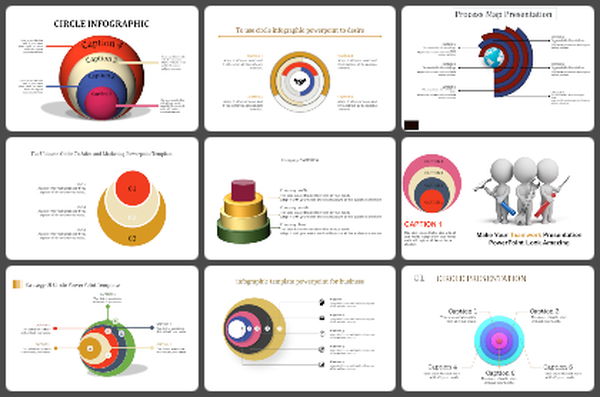
Creative PowerPoint Venn Diagram Template
Creative Venn Diagram Template
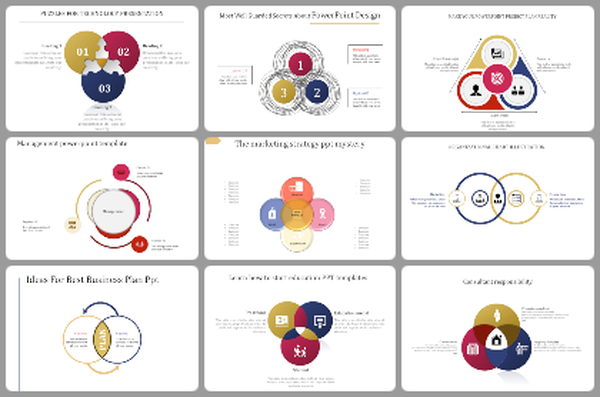
A PowerPoint Venn Diagram Template is an effective way to describe and compare two variables. The circles in a Venn diagram represent the similarity and differences of the variables. It is designed using labels and colorful circle graphics to make it more attractive and unique to the audience.
About this template
You can customize this Venn Diagram PowerPoint template to suit your needs based on your presentation. It is a four-noded template that can be used for explaining the relationship between different elements. It is easy for the presenter to use and makes the audiences understand. Download a creative Venn diagram slide here at SlideEgg.
Features of this template
- 100 % customizable slides and easy to download.
- Slides are available in different nodes & colors.
- The slide contained in 16:9 and 4:3 format.
- It is easy to change the slide colors quickly.
- It is a well-crafted template with an instant download facility.
- The best PowerPoint theme template.
- It is a well-designed presentation template.


