Customizable PPT Stock Chart Template And Google Slides


Best PPT Stock Chart Template Presentation
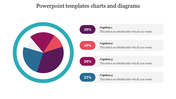
Enables one to come up with a financially rich presentation with the help of a PPT stock chart template for PowerPoint and Google Slides.
Slide Description:
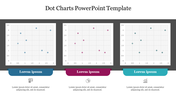
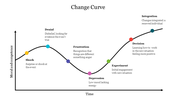
A template that comes with a comprehensive image of a stock chart, composed of five-colored indicators. It charts its month-on-month progress within the year, and the dates are also editable. This clear visualization will help represent this data in a much more engaging and information-rich way throughout your financial analysis.
Purpose of the Slide:
This slide will help you to most effectively express the performance of stock, market trends, and investment insights—the perfect report for a meeting, report, or even educational purposes.
Who can use it?
This template shall be of great help to financial advisors, investment professionals, educators, and business analysts who have to come up with impactful presentations on stock market trends and financial performance.
Get the download now.
Features of the template
- 100% customizable slides and easy to download.
- The slides contain 16:9 and 4:3 formats.
- Easy to change the colors quickly.
- It is a well-crafted template with an instant download facility.
- It is a 100% pre-designed slide.
- The slide holds vibrant colors.


You May Also Like These PowerPoint Templates
Add to Wishlist
Download
AI Customize

Add to Wishlist
Download
AI Customize

Add to Wishlist
Download
AI Customize

Add to Wishlist
Download
AI Customize

Add to Wishlist
Download
AI Customize

Add to Wishlist
Download
AI Customize

Add to Wishlist
Download
AI Customize

Free
Add to Wishlist
Download
AI Customize

Add to Wishlist
Download
AI Customize

Add to Wishlist
Download
AI Customize

Add to Wishlist
Download
AI Customize

Add to Wishlist
Download
AI Customize

Add to Wishlist
Download
AI Customize

Add to Wishlist
Download
AI Customize

Add to Wishlist
Download
AI Customize

Add to Wishlist
Download
AI Customize

Free
Add to Wishlist
Download
AI Customize

Add to Wishlist
Download
AI Customize

Add to Wishlist
Download
AI Customize

Add to Wishlist
Download
AI Customize
