Speedometer PowerPoint Templates And Google Slides Themes


Speedometer PPT Presentation Template
Transform your presentation with our Speedometer PowerPoint template.
Slide Description:
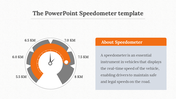
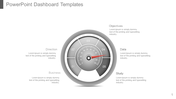
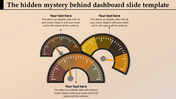
Our template features a vibrant, orange speedometer dominating the visual space, confidently pointing to 70% completion. It’s not just eye-catching; it’s intuitive. Below the speedometer, an editable caption area awaits your personalized touch. Whether you’re presenting sales figures, project progress, or survey results, this slide ensures clarity and impact.
Who Can Benefit?
Professionals: Whether you’re in marketing, finance, or project management, this template simplifies data visualization. Impress your clients, colleagues, or stakeholders with a clear, compelling speedometer.
Students: Ace your class presentations! Use this template to explain research findings, analyze trends, or showcase survey results. Your classmates and professors will appreciate your visual finesse.
Anyone: No design skills required! If you’re searching for a user-friendly template, this is it. Just download, customize, and watch your data come alive.
Download our Speedometer dashboard PowerPoint template today and transform your data into impactful insights. Your audience will thank you!
Features of the template:
- Slides are available in 4:3 & 16:9
- Get slides that are 100% customizable and easy to download
- Highly compatible with PowerPoint and Google Slides.


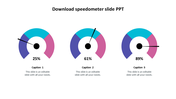
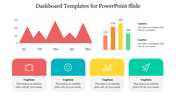
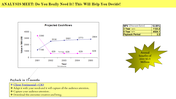
You May Also Like These PowerPoint Templates
Add to Wishlist
Download
AI Customize

Add to Wishlist
Download
AI Customize

Add to Wishlist
Download
AI Customize

Add to Wishlist
Download
AI Customize

Add to Wishlist
Download
AI Customize


Add to Wishlist
Download
AI Customize

Add to Wishlist
Download
AI Customize

Add to Wishlist
Download
AI Customize

Add to Wishlist
Download
AI Customize


Add to Wishlist
Download
AI Customize

Add to Wishlist
Download
AI Customize

Add to Wishlist
Download
AI Customize

Add to Wishlist
Download
AI Customize

Add to Wishlist
Download
AI Customize

Add to Wishlist
Download
AI Customize

Add to Wishlist
Download
AI Customize

Add to Wishlist
Download
AI Customize

Add to Wishlist
Download
AI Customize
