Free - Growth PPT and Google Slides Templates For Presentation

Free
Slide with green bar graphs representing data for three years and a professional woman standing next to the charts.
P.ID : 36322
    63 views
    20 Downloads
    Get Custom Slides by Experts
    Instantly Access Templates in PowerPoint

    PowerPoint Slide Templates


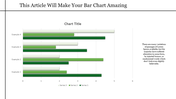
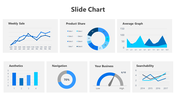
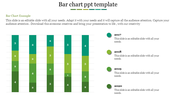
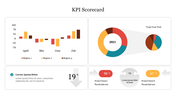
    Improve the position of your presentation by comparing values using our versatile PPT and Google Slides Templates. The slide features three distinct bar charts. Each of them represents different metrics or KPIs. The bars are labeled with percentage values. It provides a clear visualization of data trends. The accompanying years offer a chronological perspective on performance over time.

    Ideal for professionals in various fields such as business, finance, marketing and education. Suitable for delivering quarterly reports, project updates or sales forecasts. Download the template to give a different perspective to present the user's ideas.

    Features of the template

    • The slide contains 16:9 and 4:3 formats.
    • Compatible with Google slide themes and PowerPoint.
    • 100% customizable slides and free to download.
    • It is easy to change the colors of the slide quickly.
    • Well-crafted template with an instant download facility.
    Advertisement

    You May Also Like These PowerPoint Templates

    Free
    Add to Wishlist
    Download
    AI Customize
    Multicolored circular pie chart in yellow, red, and green, with labeled categories listed on the right.
    Add to Wishlist
    Download
    AI Customize
    Four donut charts in red, blue, green, and yellow, displaying percentages with corresponding content boxes below.
    Free
    Add to Wishlist
    Download
    AI Customize
    KPI dashboard with a data table on the left and a circular chart on the right, featuring shades of teal and white.
    Add to Wishlist
    Download
    AI Customize
    A chart with three vertical bars in red, purple, and orange, with icons and descriptive text on the left.
    Free
    Add to Wishlist
    Download
    AI Customize
    Bar chart with five vertical bars representing data analysis with various high, low, and volume indicators displayed.
    Add to Wishlist
    Download
    AI Customize
    A monthly PowerPoint template displaying colorful wave like graphs for each month from January to June with placeholder text.
    Add to Wishlist
    Download
    AI Customize
    KPI themed slide with data visualization including pie charts, bar graphs, line graphs, and key metrics.
    Free
    Add to Wishlist
    Download
    AI Customize
    Colorful bar chart with three data categories and corresponding bars each with caption areas.
    Add to Wishlist
    Download
    AI Customize
    Six semicircular gauges with colored indicators in red, purple, blue, yellow, pink, and green on a white backdrop.
    Free
    Add to Wishlist
    Download
    AI Customize
    Slide showcasing three different types of colored charts an area chart, a bar chart, and a line chart, with captions below.
    Add to Wishlist
    Download
    AI Customize
    Three pie charts with segmented sections and percentage labels, each chart featuring placeholder text below.
    Add to Wishlist
    Download
    AI Customize
    A pie chart template with three circular charts representing each with text and icons beside them.
    Add to Wishlist
    Download
    AI Customize
    Area chart with a teal base and five markers in yellow, red, and maroon shades representing growth percentages.
    Add to Wishlist
    Download
    AI Customize
    Awesome Dashboard PPT Template Free Download Slides
    Add to Wishlist
    Download
    AI Customize
    Pie Chart PowerPoint with Segmented Circles Slides
    Add to Wishlist
    Download
    AI Customize
    Template displaying a structured flowchart for KPI types, categorized into qualitative and quantitative evaluations.