Free - Marketing PowerPoint Slide Templates Presentation
Free

 Canva
Canva
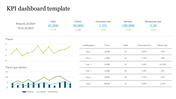
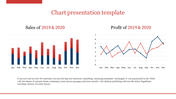
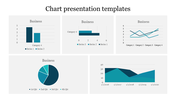
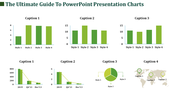

Marketing PowerPoint Template and Google Slides Themes
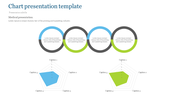
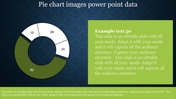
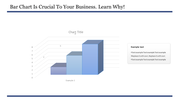
Make your marketing shine with our Marketing PowerPoint Template and Google Slides Themes. It's free and packed with three nodes, each with catchy captions, flexible title holders, and plenty of space for your ideas.
Whether you're a marketer, business owner, or educator, this template helps you share your plans and insights clearly. It's more than just a tool—it's a way to engage your audience and succeed. Merge data and creativity effortlessly, setting a new standard for impactful communication.
Improve your presentations today and start telling visual stories that impress and deliver results. Try out our Marketing PowerPoint Template now.
Features of the Template
- 100 % customizable slides.
- The slide show is in 4:3, 16:9, zip format.
- There is powerful connectivity with Google Slides and PowerPoint.
- It is simple and quick to alter the slide's color.
- An efficient template that can be easily accessed immediately.
- Well-crafted template with an instant download facility.


You May Also Like These PowerPoint Templates
Add to Wishlist
Download
AI Customize

Add to Wishlist
Download
AI Customize

Add to Wishlist
Download
AI Customize

Add to Wishlist
Download
AI Customize


Add to Wishlist
Download
AI Customize

Add to Wishlist
Download
AI Customize

Add to Wishlist
Download
AI Customize

Add to Wishlist
Download
AI Customize

Add to Wishlist
Download
AI Customize

Add to Wishlist
Download
AI Customize

Add to Wishlist
Download
AI Customize

Add to Wishlist
Download
AI Customize

Add to Wishlist
Download
AI Customize

Add to Wishlist
Download
AI Customize

Add to Wishlist
Download
AI Customize


Add to Wishlist
Download
AI Customize

Free
Add to Wishlist
Download
AI Customize

