PowerPoint report Template for Annual Report

Finance report slide displaying a table of expenses, net income, and profit from 2013 to 2019, with a bar chart below.
P.ID : 33989
    43 slides
    Creatiive Annual Report Presentation And Google Slides
    26 slides
    Best Company Annual Report PPT And Google Slides Themes
    20 slides
    Creative Annual Report PowerPoint And Google Slides
    36 slides
    Best Business Report Infographics PowerPoint Presentation
    12 slides
    Creative QBR Meaning PPT Presentation and Google Slides
    219 views
    6 Downloads
    Get Custom Slides by Experts
    Instantly Access Templates in PowerPoint

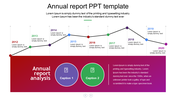
    Elegant PowerPoint Report Template Presentation

    Entice your presentation with this impressive PowerPoint Report Template with more modern approaches. 100% editable and customizable slides. You can generate a systematic and well-organized presentation without any trouble. 

    About the template:


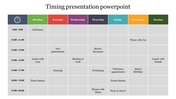
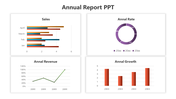
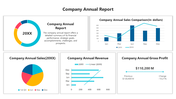
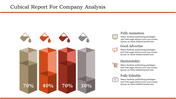
    The attractive red color Report PowerPoint Template is more elegant and helps capture the essence of your content. The brilliant table design of the template helps in providing consolidated information. You can use the bar graph to summarize a large dataset in visual form. This vibrant red color template will create a visually alluring presentation. Use this template to generate financially related reports on a monthly or annual basis. You can quickly get your point across to clients. This template is impossible to ignore.

    Features of the slide:

    • 100% editable and customizable slide
    • Appealing presentation to impress an audience
    • Easy to edit slide colors and designs
    • Best Attractive slide background
    • Create a feature-rich report presentation 
    • Slides are available to attract audiences
    Advertisement

    You May Also Like These PowerPoint Templates

    Add to Wishlist
    Download
    AI Customize
    Monthly business review slide showing project names, dates, budgets, and rates in a tabular format with a financial overview.
    Add to Wishlist
    Download
    AI Customize
    Colorful quarterly business review slide showcasing four steps with captions and icons.
    Add to Wishlist
    Download
    AI Customize
    Pack of slides featuring various layouts containing colorful bars indicating metrics on weekly report.
    Free
    Add to Wishlist
    Download
    AI Customize
    Pink gradient table with seven rows and four columns including financial data metrics for a monthly report.
    Add to Wishlist
    Download
    AI Customize
    Colorful quarterly report slide showing bar charts, a pie chart, and task timelines from 2021 to 2024 with three sections.
    Add to Wishlist
    Download
    AI Customize
    Monthly report slide with a grid layout, representing activities with relevant icons and placeholder text.
    Add to Wishlist
    Download
    AI Customize
    Survey results slide featuring four circular percentage values in different colors with text boxes for placeholder text.
    Add to Wishlist
    Download
    AI Customize
    QBR slide with four icons with descriptions accompanied by a progress bar chart displaying the status for each task.
    Add to Wishlist
    Download
    AI Customize
    Weekly schedule with seven colorful circles for each day, followed by a to do and teal notes section at the bottom.
    Add to Wishlist
    Download
    AI Customize
    Social media reports slide, including color coded bar charts for followers, age demographics, and engagement statistics.
    Add to Wishlist
    Download
    AI Customize
    Slide featuring a colorful incident report with recorded details, and a description of the event with progress percentages.
    Add to Wishlist
    Download
    AI Customize
    April Slides PowerPoint and Google Slides Themes
    Add to Wishlist
    Download
    AI Customize
    Circular infographic with Q1 to Q4 in blue, maroon, green, and red segments surrounding a central circle with text.
    Add to Wishlist
    Download
    AI Customize
    Slide displaying progress metrics with circular charts and recruitment increase/decrease visualization with icons and text.