Seven Node Charts PowerPoint Presentation Slide

PowerPoint slide with multiple chart types, including bar, line, and pie charts with different styles.
P.ID : 6146
    1.8K+ views
    177 Downloads
    Get Custom Slides by Experts
    Instantly Access Templates in PowerPoint

    Editable Charts for Presentation Templates


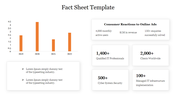
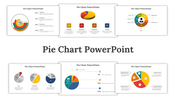
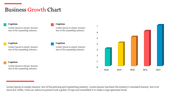
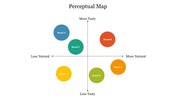
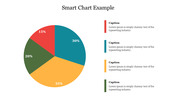
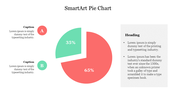
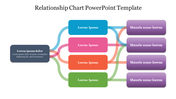
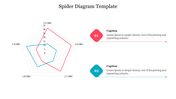
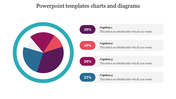
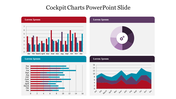
    Elevate your presentations with our PowerPoint Charts Slides, the ultimate guide to creating impactful visualizations. With its unique Style-1 design, this template offers a variety of chart options, including bar charts, pie charts, and a world map. Each slide is carefully crafted to be attractive, engaging, and informative, allowing you to effectively communicate your data-driven insights. Whether you're showcasing market trends, sales figures, or global analytics, our template provides the perfect visual framework to captivate your audience. Take your presentations to the next level and make your data come alive with our comprehensive collection of chart slides.


    Features of the template

    • 100% customizable slides and easy to download.
    • Slides are available in different nodes & colors.
    • The slide contains 16:9 and 4:3 formats.
    • Easy to change the slide colors quickly.
    • Well-crafted template with an instant download facility. 
    • Access on both MS PowerPoint and Google Slides.
    • Three styles of charts are added.
    Advertisement

    You May Also Like These PowerPoint Templates

    Free
    Add to Wishlist
    Download
    AI Customize
    Cute PowerPoint Radar Chart Templates For Presentation
    Add to Wishlist
    Download
    AI Customize
    Hoshin Kanri slide with a blue grid design labeled sections for annual objectives and a compass icon at the bottom.
    Free
    Add to Wishlist
    Download
    AI Customize
    Pie Chart Template Free Download PPT And Google Slides
    Add to Wishlist
    Download
    AI Customize
    Bar graph on a slide showing data from 2016 to 2019, with a title about statistics and a caption area section.
    Add to Wishlist
    Download
    AI Customize
    Pareto Analysis PowerPoint And Google Slides Template
    Add to Wishlist
    Download
    AI Customize
    Editable Dot Charts PowerPoint Template For Presentation
    Add to Wishlist
    Download
    AI Customize
    Slide showcasing survey data with percentage figures in colored text boxes and icons with a comparative bar chart.
    Add to Wishlist
    Download
    AI Customize
    Hexagonal web chart with blue and red lines showing financial data for six business areas at the corners.
    Add to Wishlist
    Download
    AI Customize
    Best Change Curve PowerPoint Template Readily For You
    Add to Wishlist
    Download
    AI Customize
    Innovative Cockpit Charts PowerPoint Download PPT Slides
    Add to Wishlist
    Download
    AI Customize
    A line chart  slide showing data trends across seven items with two percentage indicators with icons and caption areas.
    Add to Wishlist
    Download
    AI Customize
    Color coded timeline chart slide showing tasks over 10 months, from june 2019 to february 2020, with labeled milestones.
    Add to Wishlist
    Download
    AI Customize
    Attractive Pricing Strategy Chart For Presentation Slide
    Free
    Add to Wishlist
    Download
    AI Customize
    Color-coded Gantt chart template for project management, displaying four phases across quarters with colorful text boxes.
    Add to Wishlist
    Download
    AI Customize
    Innovative KWL Chart Presentation Slide Template Design
    Add to Wishlist
    Download
    AI Customize
    Timeline chart slide depicting four colored project phases with major milestones and key dates.
    Add to Wishlist
    Download
    AI Customize
    Creative Pie Chart PowerPoint Presentation Template
    Add to Wishlist
    Download
    AI Customize
    Two line graphs comparing data trends with different colors, featuring seven data points on each chart.