Editable Dashboard PowerPoint Template with Background

Car dashboard slide with various indicators, displaying speed, temperature, and trip information, overlaid with text.
P.ID : 4055
    276 views
    14 Downloads
    Get Custom Slides by Experts
    Instantly Access Templates in PowerPoint

    Creative Education PowerPoint Template with Three Nodes


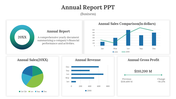
    Curious about steering your presentations with precision? The dashboard PowerPoint templates are the key! Picture this: a sleek vehicle dashboard background setting the stage for impactful presentations. Tailored for executives, project managers, and professionals aiming to present complex data to users.

    The template boasts a title holder and strategically placed text areas, creating a visually engaging and organized layout. Ideal for those seeking to convey key metrics, project updates, or business performance with clarity.

    Are you ready to accelerate your presentations? Click now to access the template, where visual appeal meets strategic communication. Propel your presentations, engage your stakeholders, and drive your narrative with confidence. Your journey to impactful presentations starts here!

    Features of the template


    • 100% customizable slides are easy to download.
    • Slides are available in different colors.
    • The slide has 4:3 and 16:9 formats.
    • It is easy to change the slide colors quickly.
    • It has a cute design to impress an audience.
    • Create feature-rich, animated presentations.
    Advertisement

    You May Also Like These PowerPoint Templates

    Free
    Add to Wishlist
    Download
    AI Customize
    Histogram on the left and Pareto chart in pink and orange with cumulative line on the right.
    Add to Wishlist
    Download
    AI Customize
    A pie chart featuring five segments, each labeled with percentages, surrounded by text on a blue background.
    Add to Wishlist
    Download
    AI Customize
    Waterfall PowerPoint chart displaying increases and decreases for eight items with color coded bars for each change.
    Add to Wishlist
    Download
    AI Customize
    Horizontal bar graph slide with four colored steps and corresponding descriptions on the right.
    Add to Wishlist
    Download
    AI Customize
    Slide with two donut charts displaying values and a text section on the right with a blurred background image.
    Add to Wishlist
    Download
    AI Customize
    Stacked column chart template displaying proportional data distribution across four categories using three series.
    Add to Wishlist
    Download
    AI Customize
    Colorful circular diagram slide illustrating four corporate strategy methods with labels and percentages.
    Add to Wishlist
    Download
    AI Customize
    KWL chart with sections  in blue, green, and red, each column containing placeholder text.
    Add to Wishlist
    Download
    AI Customize
    Vertical bar chart in red shades, displaying yearly data from 2017 to 2020, with detailed labels on the right.
    Add to Wishlist
    Download
    AI Customize
    Dark themed layout featuring four pie charts with shaded segments, each displaying different percentages.
    Add to Wishlist
    Download
    AI Customize
    Stacked traction bar graph with red, blue, green, orange bars labeled with percentage values and caption areas.
    Add to Wishlist
    Download
    AI Customize
    Green shaded bar chart displaying data from 2016 to 2021, with three numbered captions below.
    Add to Wishlist
    Download
    AI Customize
    Chart slide showing market supply data from 2004 to 2014 with red bars and percentage annotations.
    Add to Wishlist
    Download
    AI Customize
    Dashboard with four bar charts in yellow, green, teal, and red, comparing project risks and change requests.
    Add to Wishlist
    Download
    AI Customize
    Comparison slide featuring male and female icons, paired with captions and bar chart below, in blue and green tones.
    Add to Wishlist
    Download
    AI Customize
    Project Gantt chart with task descriptions, percentage completion, and horizontal progress bars.
    Add to Wishlist
    Download
    AI Customize
    Key performance indicator slide displaying data bars, percentages, and distinct icons in a structured layout.