Dashboard PPT And Google Slides Template

Infographic slide showing plant species each with a labeled circular progress chart indicating percentages.
P.ID : 34848
    141 views
    2 Downloads
    Get Custom Slides by Experts
    Instantly Access Templates in PowerPoint

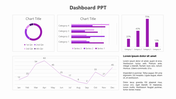
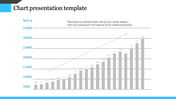
    PowerPoint Dashboard Template 


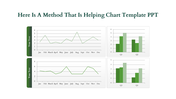
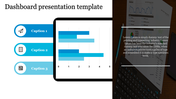
    Provide the strategic planning sessions, by introducing the PPT And Google Slides Dashboard Template. The slide has a detailed strategy graph. It  showcases progressive years and scale values, with ample space to add relevant details and insights. Ideal for business analysts, strategic planners, project managers and corporate executives. 

    Suitable for visualization of trends, progress, and key performance indicators. Suitable for analyzing business performance, outlining strategic initiatives or tracking project progress. Download now to create a dashboard on planning sessions.

    Features of the template

    • The slide contains 16:9 and 4:3 formats.
    • Compatible with Google slide themes and PowerPoint.
    • 100% customizable slides and free to download.
    • It is easy to change the colors of the slide quickly.
    • Well-crafted template with an instant download facility.
    Advertisement

    You May Also Like These PowerPoint Templates

    Add to Wishlist
    Download
    AI Customize
    Chart presentation template with a bar graph showing the progress of four projects with percentages.
    Free
    Add to Wishlist
    Download
    AI Customize
    Line chart template with three data series in blue, teal, black, and text sections.
    Add to Wishlist
    Download
    AI Customize
    Layered area chart with red and green segments, numeric axes, and two icons below with captions on a white background.
    Add to Wishlist
    Download
    AI Customize
    Gradient-styled horizontal bar chart with blue and green bars, labeled text areas, and a light blue background.
    Free
    Add to Wishlist
    Download
    AI Customize
    Bubble chart on the right with varying circle sizes and a dark blue section on the left featuring three headings and text.
    Add to Wishlist
    Download
    AI Customize
    Chart presentation template displaying monthly data for Visitors, New Customers, and Leads with bar and line charts.
    Add to Wishlist
    Download
    AI Customize
    Chart presentation template showing statistics for total clients, projects, and earnings with bar graphs.
    Add to Wishlist
    Download
    AI Customize
    Gantt chart PowerPoint template displaying project tasks over a four week timeline with placeholder text.
    Add to Wishlist
    Download
    AI Customize
    Versatile PowerPoint Chart Templates for Data Insights
    Add to Wishlist
    Download
    AI Customize
    Horizontal bar chart with three color-coded series, labeled values, and a left side legend with numbered captions.
    Add to Wishlist
    Download
    AI Customize
    Slide deck with multiple circular progress bars in various colors, showing percentages and captions below.
    Add to Wishlist
    Download
    AI Customize
    Slide with a horizontal bar chart on the left and 3D cylindrical percentage charts in blue, green, and teal, on the right.
    Add to Wishlist
    Download
    AI Customize
    Horizontal bar chart with four labeld sections A to D, in purple, pink, teal, and blue, and captions below.
    Add to Wishlist
    Download
    AI Customize
    Business chart slide with a red and black line graph on the left, a red bar chart on the right, and two description sections.
    Add to Wishlist
    Download
    AI Customize
    Best Waterfall In PowerPoint Presentation Slide Designs
    Free
    Add to Wishlist
    Download
    AI Customize
    Layered area chart with Series 1 in yellow, Series 2 in orange, and Series 3 in black, showing data trends over time.