Incredible PowerPoint Dashboard Design Slides

Dashboard slide showing Zantedeschia, Celosia, and Calendula growth data with a bar chart from 2012 to 2017.
P.ID : 34886
    1.8K+ views
    158 Downloads
    Get Custom Slides by Experts
    Instantly Access Templates in PowerPoint

    Dashboard PPT Templates and Google Slides

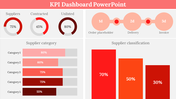
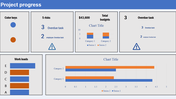
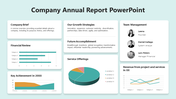
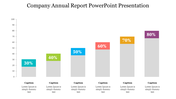
    Explore our wide range of professionally designed PowerPoint dashboard presentation templates that are perfect for students, professionals, and anyone looking to make impactful presentations. A dashboard PPT is like your very own command center for information. It's a visually appealing and user-friendly way to display key data, charts, and graphs in one place. Our templates offer a seamless blend of style and functionality, allowing you to effortlessly create dynamic dashboards that captivate your audience. Whether you need to track project progress, analyze data, or present important information, our templates have got you covered. Level up your presentations today with our easy-to-use dashboard templates and impress everyone with your visual storytelling skills!

    Features of the template 

    • 100% customizable slides and easy to download. 
    • Slides are available in different nodes & colors. 
    • The slide contains 16:9 and 4:3 formats. 
    • Easy to change the colors of the slides quickly. 
    • Well-crafted template with an instant download facility. 
    • Highly compatible with PowerPoint and Google Slides. 
    Advertisement

    You May Also Like These PowerPoint Templates

    Add to Wishlist
    Download
    AI Customize
    Radar PowerPoint Presentation Templates and Google Slides
    Add to Wishlist
    Download
    AI Customize
    Relationship chart slide with colored blocks connected by curving lines representing data flow with placeholder text.
    Add to Wishlist
    Download
    AI Customize
    Pentagon-shaped spider chart displaying two datasets in red and blue with two numbered caption areas.
    Free
    Add to Wishlist
    Download
    AI Customize
    Four vertical bar charts in orange, blue, red, and green on a white background, each with captions below.
    Add to Wishlist
    Download
    AI Customize
    Colorful pie chart with four segments in blue, purple, red, and orange, with matching text boxes showing percentages.
    Add to Wishlist
    Download
    AI Customize
    Editable Cockpit Charts PowerPoint Slide Template Design
    Add to Wishlist
    Download
    AI Customize
    Blank chart slide with a weekly layout from monday to sunday, featuring a grid for scheduling or organizing tasks.
    Free
    Add to Wishlist
    Download
    AI Customize
    Cute PowerPoint Radar Chart Templates For Presentation
    Add to Wishlist
    Download
    AI Customize
    Hoshin Kanri slide with a blue grid design labeled sections for annual objectives and a compass icon at the bottom.
    Free
    Add to Wishlist
    Download
    AI Customize
    Pie Chart Template Free Download PPT And Google Slides
    Add to Wishlist
    Download
    AI Customize
    Bar graph on a slide showing data from 2016 to 2019, with a title about statistics and a caption area section.
    Add to Wishlist
    Download
    AI Customize
    Stacked Bar Chart PowerPoint Template Presentation
    Add to Wishlist
    Download
    AI Customize
    Pareto Analysis PowerPoint And Google Slides Template
    Add to Wishlist
    Download
    AI Customize
    Editable Dot Charts PowerPoint Template For Presentation
    Add to Wishlist
    Download
    AI Customize
    Slide showcasing survey data with percentage figures in colored text boxes and icons with a comparative bar chart.
    Add to Wishlist
    Download
    AI Customize
    Hexagonal web chart with blue and red lines showing financial data for six business areas at the corners.
    Add to Wishlist
    Download
    AI Customize
    Best Change Curve PowerPoint Template Readily For You
    Add to Wishlist
    Download
    AI Customize
    Innovative Cockpit Charts PowerPoint Download PPT Slides
    Add to Wishlist
    Download
    AI Customize
    A line chart  slide showing data trends across seven items with two percentage indicators with icons and caption areas.