Best Cube PowerPoint Template and Google Slides

3D cube layout with red and black blocks stacked vertically, surrounded by horizontal gray text boxes on both sides.
P.ID : 11093
    330 views
    8 Downloads
    Get Custom Slides by Experts
    Instantly Access Templates in PowerPoint

    Cube PowerPoint Template and Google Slides


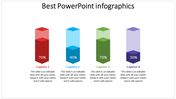
    This template features four cubes stacked in ascending size, colored red, representing growth. The top cube is black and slightly larger, symbolizing the final stage. Each cube has a caption box for you to customize. This layout provides a clear and visually engaging way to showcase a four-stage growth process or the building blocks of business success.

    This template is a valuable tool for business professionals, entrepreneurs, marketing teams, or anyone who needs to communicate a strategic growth plan or the key stages of building a successful business.

    Features of this template:


    • 100 % customizable slides are easy to download. 
    • Slides are available in different nodes and colors.
    • The slide was contained in 16:9 and 4:3 formats.
    • It is easy to change the slide colors quickly.
    • Well-crafted template with an instant download facility.
    • The clear layout of this template will help you design a professional-looking presentation.
    • The multi-color visuals on this slide will make your presentation eye-catching.
    Advertisement

    You May Also Like These PowerPoint Templates

    Add to Wishlist
    Download
    AI Customize
    Abstract slide featuring four vertical bars with captions and vibrant colors representing percentages in a white backdrop.
    Add to Wishlist
    Download
    AI Customize
    Infographic with a four level bar chart in red, green, orange, and pink, paired with percentage labels and text boxes.
    Add to Wishlist
    Download
    AI Customize
    Colorful bar chart PowerPoint slide showing percentage based growth from 25 to 100 percent with placeholder text.
    Add to Wishlist
    Download
    AI Customize
    Mekko chart slides in red and yellow gradients, showcasing various data visualizations with bars and stacked charts.
    Add to Wishlist
    Download
    AI Customize
    Chart template with data visualization in teal bars, quote section with large quotation mark, and percentage highlight.
    Add to Wishlist
    Download
    AI Customize
    Slide with five circular pie charts in orange, green, blue, gray, and red, arranged dynamically, displaying a percentage.
    Add to Wishlist
    Download
    AI Customize
    KWL slide deck with various layouts, using purple, orange, and red, illustrating the learning process in a structured format.
    Free
    Add to Wishlist
    Download
    AI Customize
    PPT Chart Infographics Free Download Design Slides
    Add to Wishlist
    Download
    AI Customize
    Colorful bar chart with five vertical bars in ascending order, each labeled with positive values and curved line above.
    Add to Wishlist
    Download
    AI Customize
    Slide with a stacked area chart in shades of pink, green, and yellow, and three matching circular data labels on the right.
    Add to Wishlist
    Download
    AI Customize
    Triangular chart with overlapping colored sections labeled 30% to 100%, each linked to captions areas below.
    Add to Wishlist
    Download
    AI Customize
    Best Business PowerPoint Chart Infographics Slide
    Add to Wishlist
    Download
    AI Customize
    Four colored bar charts in red, yellow, green, and orange, each with captions below, displayed on a white background.
    Free
    Add to Wishlist
    Download
    AI Customize
    Donut chart template with four segments representing different quarters with placeholder text.
    Free
    Add to Wishlist
    Download
    AI Customize
    Gantt chart with green horizontal bars representing tasks and percentages, spanning from January to December 2019.
    Add to Wishlist
    Download
    AI Customize
    Boost Engagement Rate PowerPoint and Google Slides Themes
    Add to Wishlist
    Download
    AI Customize
    Chart visualization slide with a circular pie chart and a horizontal bar graph for team member progress on tasks.
    Free
    Add to Wishlist
    Download
    AI Customize
    Attractive PowerPoint Templates Chart Infographics Design
    Add to Wishlist
    Download
    AI Customize
    Bar chart showing percentages from 2017 to 2021, with bars in blue, green, orange, red, and pink, and a woman illustration.